
Thursday - Commodities, Currencies
What is this spreadsheet telling us?
The only currency showing any real strength is from Brazil. The US Dollar is well within the range of the other currencies.
I think this helps explain why you see almost all the foreign stock ETFs doing well along with the US stock ETFs.
I also think this helps explain why you see oil prices moving sideways.
Bottom line: Currencies are stable and without any one-sided out-performance (such as the US Dollar in 2014). This is a favorable scenario for stock markets.

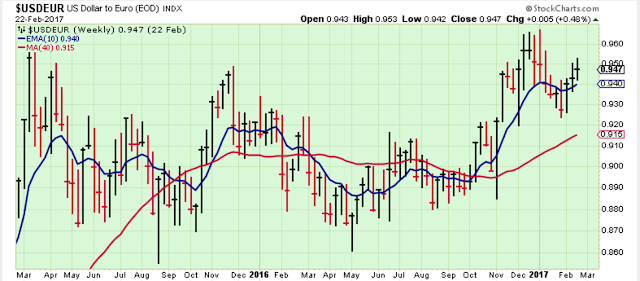
Since the election in November, the USD has been strong against the Euro, but peaked at the top of the range established over the last two years.
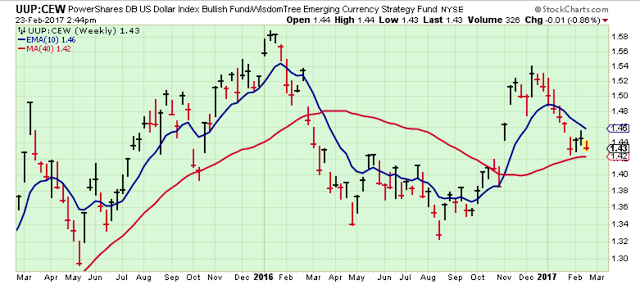
The USD was also strong against Emerging Markets currencies after the election, but so far in 2017, the ratio peaked and reversed.
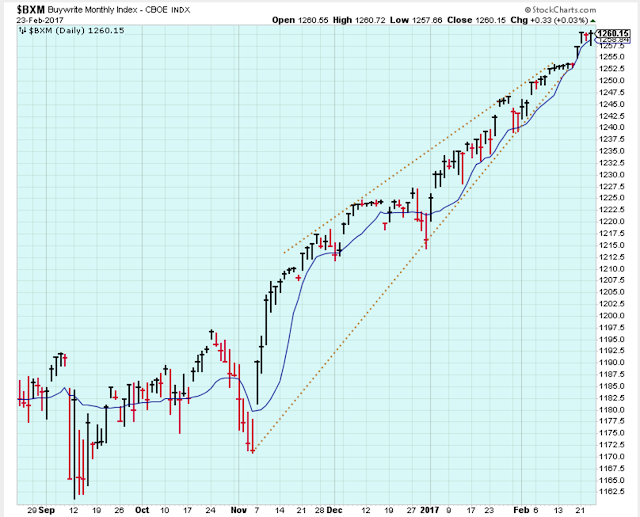
The Short-Term Trend
A bit of volatility is finally starting to appear in the market. Maybe the rally is getting wobbly?
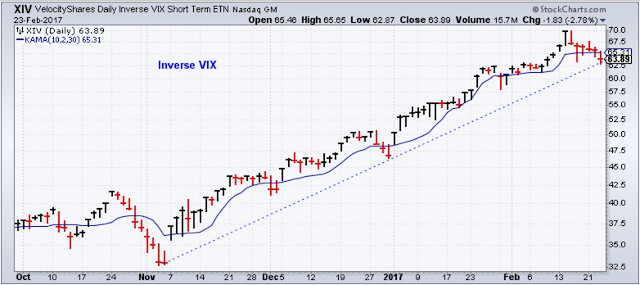
No weakness showing in this chart yet.
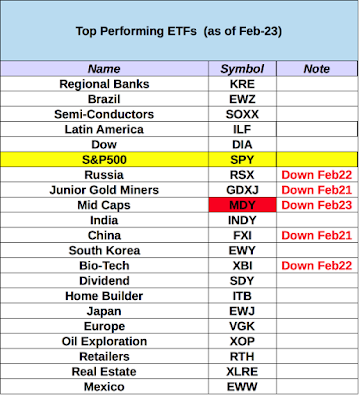
Sectors
There were no changes to the primary sectors again today, but this second spreadsheet of focused ETFs has shown changes over the last few days.
A word of caution. Just because the ETF drops out of leadership doesn't mean it is a sell.
And also remember, this is a blog and not a subscription newsletter. I use a bit of my own judgment regarding which ETFs are leading. You should do the same. Don't just take my word for it.
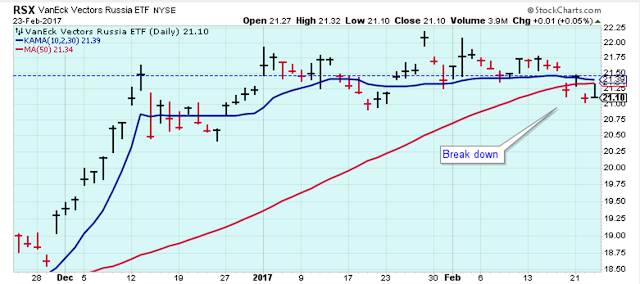
I don't mean to keep picking on RSX, and this is not a weak looking chart. But it is testing the lower range, and energy stocks have been weak.
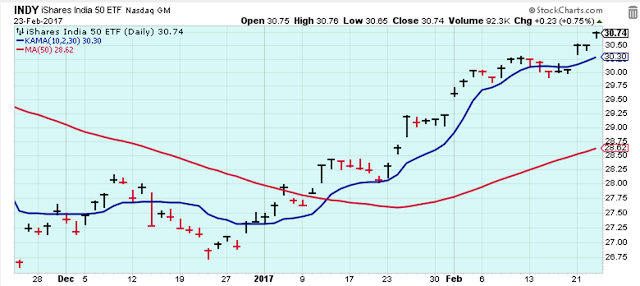
There is a nice rally taking place here for these India stocks.
Disclaimer: I am not a registered investment advisor. My comments above reflect my view of the market, ...
more

