
The Year In Review, 2018: Blowhards At Bay?
Last year’s recap was subtitled “Fighting against the normalization of lying”. At least this year, lies are called lies. Now it’s time to shun the liars, and relegate them to where they belong.
January: Stephen Moore continues to lie and lie and lie, as shown in “Further documentation on Stephen Moore is a liar.” He says the Federal deficit is a trillion dollars when it’s been nowhere near that.
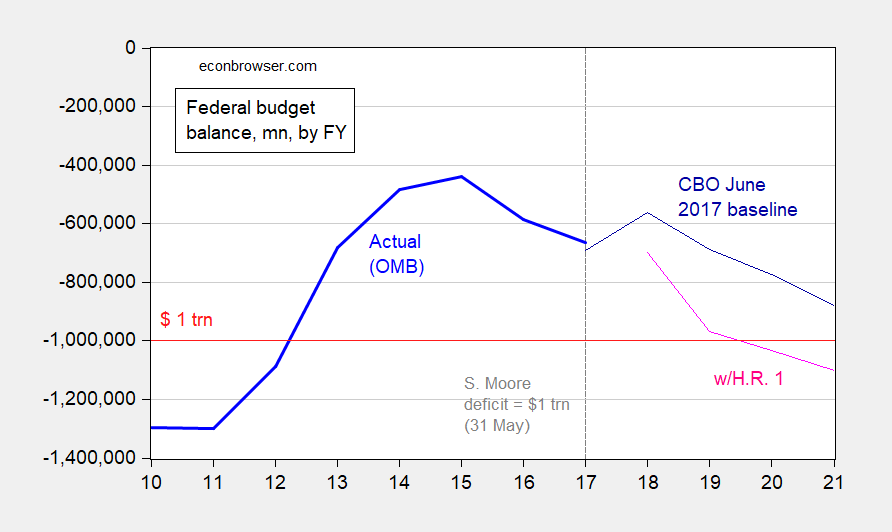
Figure 1: Federal budget balance as reported by OMB (bold blue), and CBO projection (dark blue), and implied budget balance under HR 1 Tax Cuts and Jobs Act (pink), in millions of dollars by fiscal year. Source: OMB via FRED, CBO.
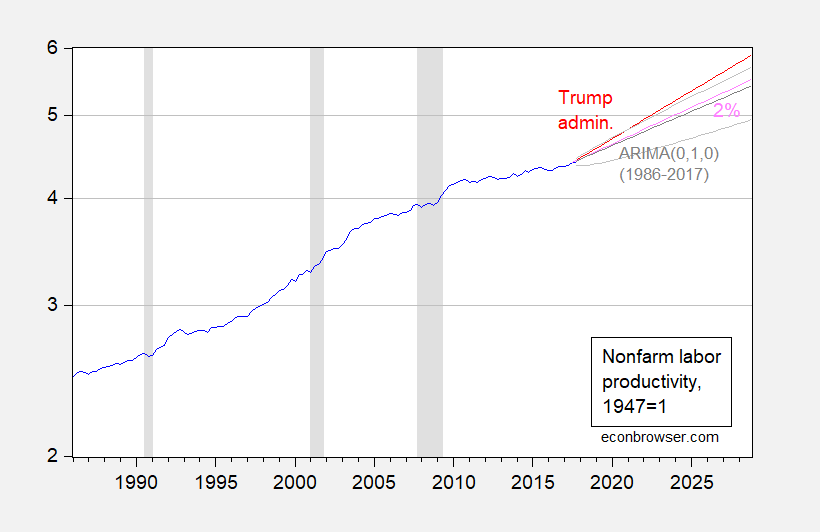
Figure 2: Nonfarm real output per hour, 1947Q1=1 (blue), Trump Administration forecast of 2.6% (red), historical average (1953Q2-2017Q3) growth rate of 2% (pink). NBER defined recession dates shaded gray. Source: BLS via FRED, NBER, CEA and author’s calculations.
March: Recounting Kudlow’s (truly amazing) forecasting record. I have no doubt this record will continue to grow.

Figure 3: Case-Shiller US National Home Price Index, s.a., deflated by CPI-all (blue, left scale), and real GDP, bn. Ch.2009$ SAAR (black, right scale). NBER defined recession dates shaded gray. Red line at 20 June 2005 comment on the housing bubble, and pink line at 7 December 2007 on recession. Source: S&P, BLS via FRED, BEA (2017Q4 2nd release), NBER, and author’s calculations.
April: You can’t cite an index without some crazy person saying the index is “liberal”. Behold, by the critics’ criterion, the VIX is suspect. Round up the S&P500!
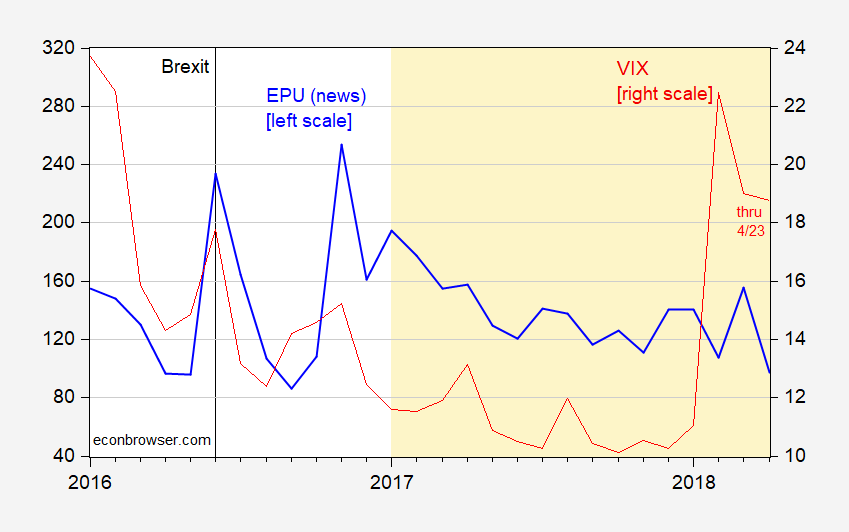
Figure 4: Case-Shiller US National Home Price Index, s.a., deflated by CPI-all (blue, left scale), and real GDP, bn. Ch.2009$ SAAR (black, right scale). NBER defined recession dates shaded gray. Red line at 20 June 2005 comment on housing bubble, and pink line at 7 December 2007 on recession. Source: S&P, BLS via FRED, BEA (2017Q4 2nd release), NBER, and author’s calculations.
May: Donald Trump in rally says Mexico will pay for the wall, and “they’ll enjoy it”, verifying that all that is old is new again…

Figure 6: “Throwing Down the Ladder by Which They Rose,” by Thomas Nast, 23 July 1870. Source
June: People should not comment on statistics without knowing … statistics. It’s amazing how many people try to, even purported “policy analysts”. It is truly amazing how many people misunderstand a “confidence interval”.
July: Again! Stephen Moore Lies and Lies and Lies (and Hence Belongs in the Trump NEC). He says Obama never got near to 3% growth. Hmm. Doing year-on-year instead of SAAR doesn’t change the story.
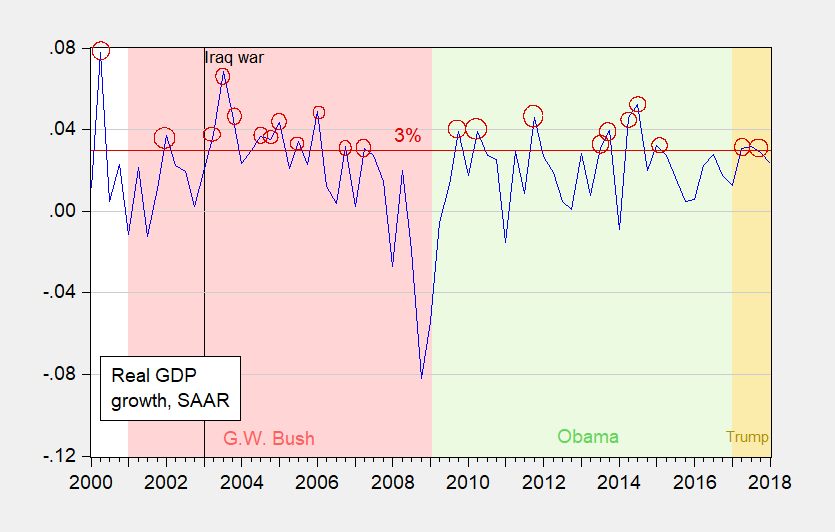
Figure 7: Quarter on quarter real GDP growth, SAAR (blue). Horizontal red line at 3% growth. Circles denote 3% or greater growth. Source: BEA, and author’s calculations.
August: Don’t make absolutist statements about statistics if you want to be taken seriously, as discussed in Forecasts and forecasts without confidence intervals puerto rico
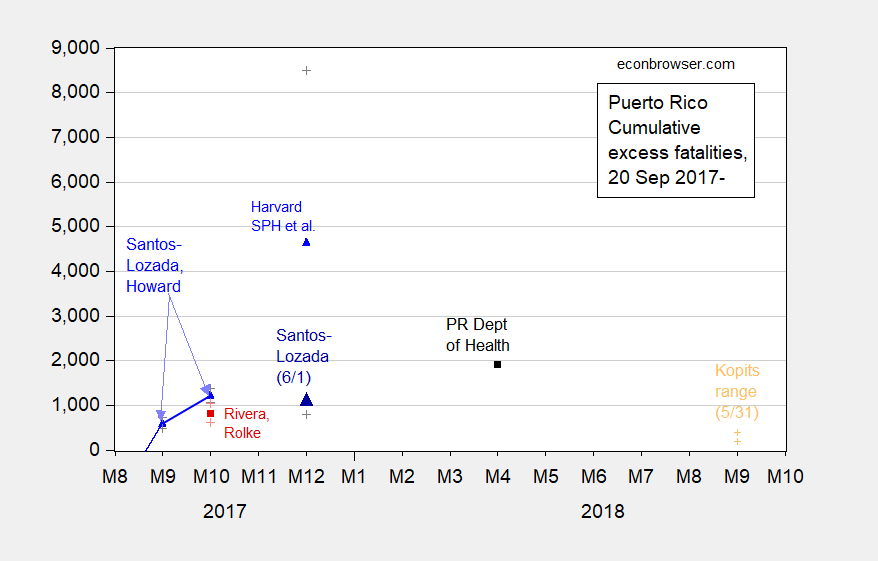
Figure 8: Quarter on quarter real GDP growth, SAAR (blue). Horizontal red line at 3% growth. Circles denote 3% or greater growth. Source: BEA, and author’s calculations
The key illustrative quote is from Steven Kopits:
Thus, the data suggests that the hurricane accelerated the deaths of ill and dying people, rather than killing them outright. I would expect the excess deaths at a year horizon (through, say, Oct. 1, 2018) to total perhaps 200-400. Still a notable number, but certainly not 4,600.
The current official estimate is 2975. I think this number is closer to 4600 than Mr. Kopits’ unambiguously definitive number of 200-400.
September: The supply-sider … dream … of a revenue boom in the wake of the Tax Cut and Jobs Act fails to materialize. But don’t expect Laffer, Kudlow, Mulvaney, Scott Walker, Sam Brownback, etc. to learn.

Figure 9: BEA, 2018Q2 3rd release.
October: Of all people, Corey Lewandowsk says the Fed is a “rogue agency”.
November: The trade war was not won “before the leaves fall”. Agriculture edition. (I call this the CoRev memorial post).
December: Stephen Moore says Powell should resign… Actually, he says the entire FOMC should be fired:
The Fed has been way too tight. They made a major blunder three months ago with raising the rates. It’s caused a deflation in commodity prices. And I will say this, David, if the Fed raises interest rates tomorrow they should all be fired for economic malpractice.
And so we end 2018 as we begin: Stephen Moore as poster child for dissemblement and/or statistical incompetence. Let 2019 be the year that Moore is relegated to FoxNews where he belongs. At least Political Calculation’s Ironman finally understood what a dead weight loss is. #TFA
Disclosure: None.


