The World Country Top 4 ETF Strategy – A Way To Fight Rising Rates And A Stalling US Stock Market
Summary
• The World Country Top 4 strategy is a strongly momentum driven strategy creating high returns.
• The strategy profits from a maximum global diversification.
• With a 20-year CAGR of 20.7% the strategy has a much lower volatility and lower risk than an S&P 500 investment.
In my last articles I described various momentum strategies with variable allocations using our maximum Sharpe method. A good example how to build such a strategy is the Universal Investment Strategy (UIS) which always invests in a variable allocation of TLT and SPY. However, UIS is a strictly a U.S.-based equity and bond strategy. In the short term, this strategy cannot do much better than its own underlying ETFs, namely SPY and TLT.
Today, many market analysts are less optimistic about the US market. The US stock market may have culminated after 6 very strong years following the 2008 subprime crash. Treasuries, at least in the past 2 months, are underperforming as they begin to anticipate rising yields. It is possible that the UIS strategy underperforms for a few months. Keep in mind that the UIS strategy has been backtested for more than 20 years and I am quite sure that it will continue to work in the future. However, as with ETFs, every so often, one has to evaluate which strategies outperform and possibly switch some capital to the better performing ones.
We have several new strategies under development (e.g., Countries, Nasdaq 100, Dow 30, US Industries) and we are already investing in these strategies, as to validate them before publication.
To address an underperforming US market, I think the best of these strategies is the Country rotation strategy, which always invests in the top 3 to 4 of 49 countries. One thing is for sure: there are always countries in this selection which are doing well, unless there is a major global crisis. During global crisis, all country equity markets may struggle, while money will rush to safe assets like treasuries. Individual country ETFs can easily lose 50% or more of its value if there is a bad government in place. However, after such a period, most of the time, the next government will be more market oriented and the ETF will recover. This political influence of changing governments creates good up and down movements of the country ETFs and these movements are quite independent of the world stock markets. So these country ETFs are well suited for ETF rotation momentum strategies.
If you look at the ETF table at the end of this article, then you will see that there are quite a lot of interesting countries, in which a normal investor would probably never invest without the help of such a strategy.
At the moment the strategy is for example invested in:
30% – EWJ (iShares MSCI Japan Index Fund)
20% – EWL (iShares MSCI Switzerland)
20% – EWS (iShares MSCI Singapore Index)
30% – EIS (iShares MSCI Israel)
If you read financial papers, you may from time to time, read of these countries. But by the time you read the positive articles in the press, it is already too late to invest. The country strategy uses a look-back period of 68 trading days. This means that it only needs a little bit more than 3 month to detect if a country is changing from a loser to a winner.
Not all ETFs are single countries. Some represent regions, like for example Africa, the Gulf states or Frontier markets. These ETFs allow you to invest in regions where a single country ETF would be much too small and volatile.
Country ETFs can be quite volatile, so a Top 1 ETF strategy would be much too dangerous. With 50 ETFs you can invest in quite a lot of top ETFs. For Hedge funds, we would even invest in the top 10 ETFs. For the individual investor the Top 4 ETF strategy gives the best results. It will smooth out single ETF volatility while simplifying execution and reducing costs. It should be easy and cheap to rotate these 4 ETFs once a month if you have a good discount broker account. Most of the time you will only need to rotate 2 ETFs every month since the strategy may stay invested in the other two for longer periods.
Besides country ETFs you still need a “safe haven” asset in the case of a market correction. The best safe haven asset is the long term Treasury bond. Rising rates do not negatively affect the strategy in this case. Once the markets crash, Treasuries quickly become the asset to go to for many investors, and this will remain so even in a raising rate environment.
In our strategy we use the TMF 3x leveraged long-term Treasury (20yr) ETF. The 3x leverage of TMF makes sure that we can hedge the volatility of the other country ETFs with a relatively small amount of TMF ETFs. Normally the strategy will invest in 0-30% TMF Treasury ETFs and 70% or more country ETFs. TMF effectively reduces the volatility and risk of the strategy. The volatility is nearly reduced by a factor of 2 and the strategy is less volatile than a normal S&P 500 investment.
Another advantage of TMF is that you do not have to pay the 30% withholding tax on the dividends like with non-leveraged bond ETFs.
The strategy uses a dynamic ranking method using our modified Sharpe ratio. The country ETFs and the TMF treasury are mixed together to achieve the maximum modified Sharpe ratio for the lookback period. Here also we use a volatility attenuator of 2, which means that volatility has a slightly higher weight in the formula. If Treasuries don’t do well then the strategy will not invest in Treasuries.
Backtest description:
20 year backtest
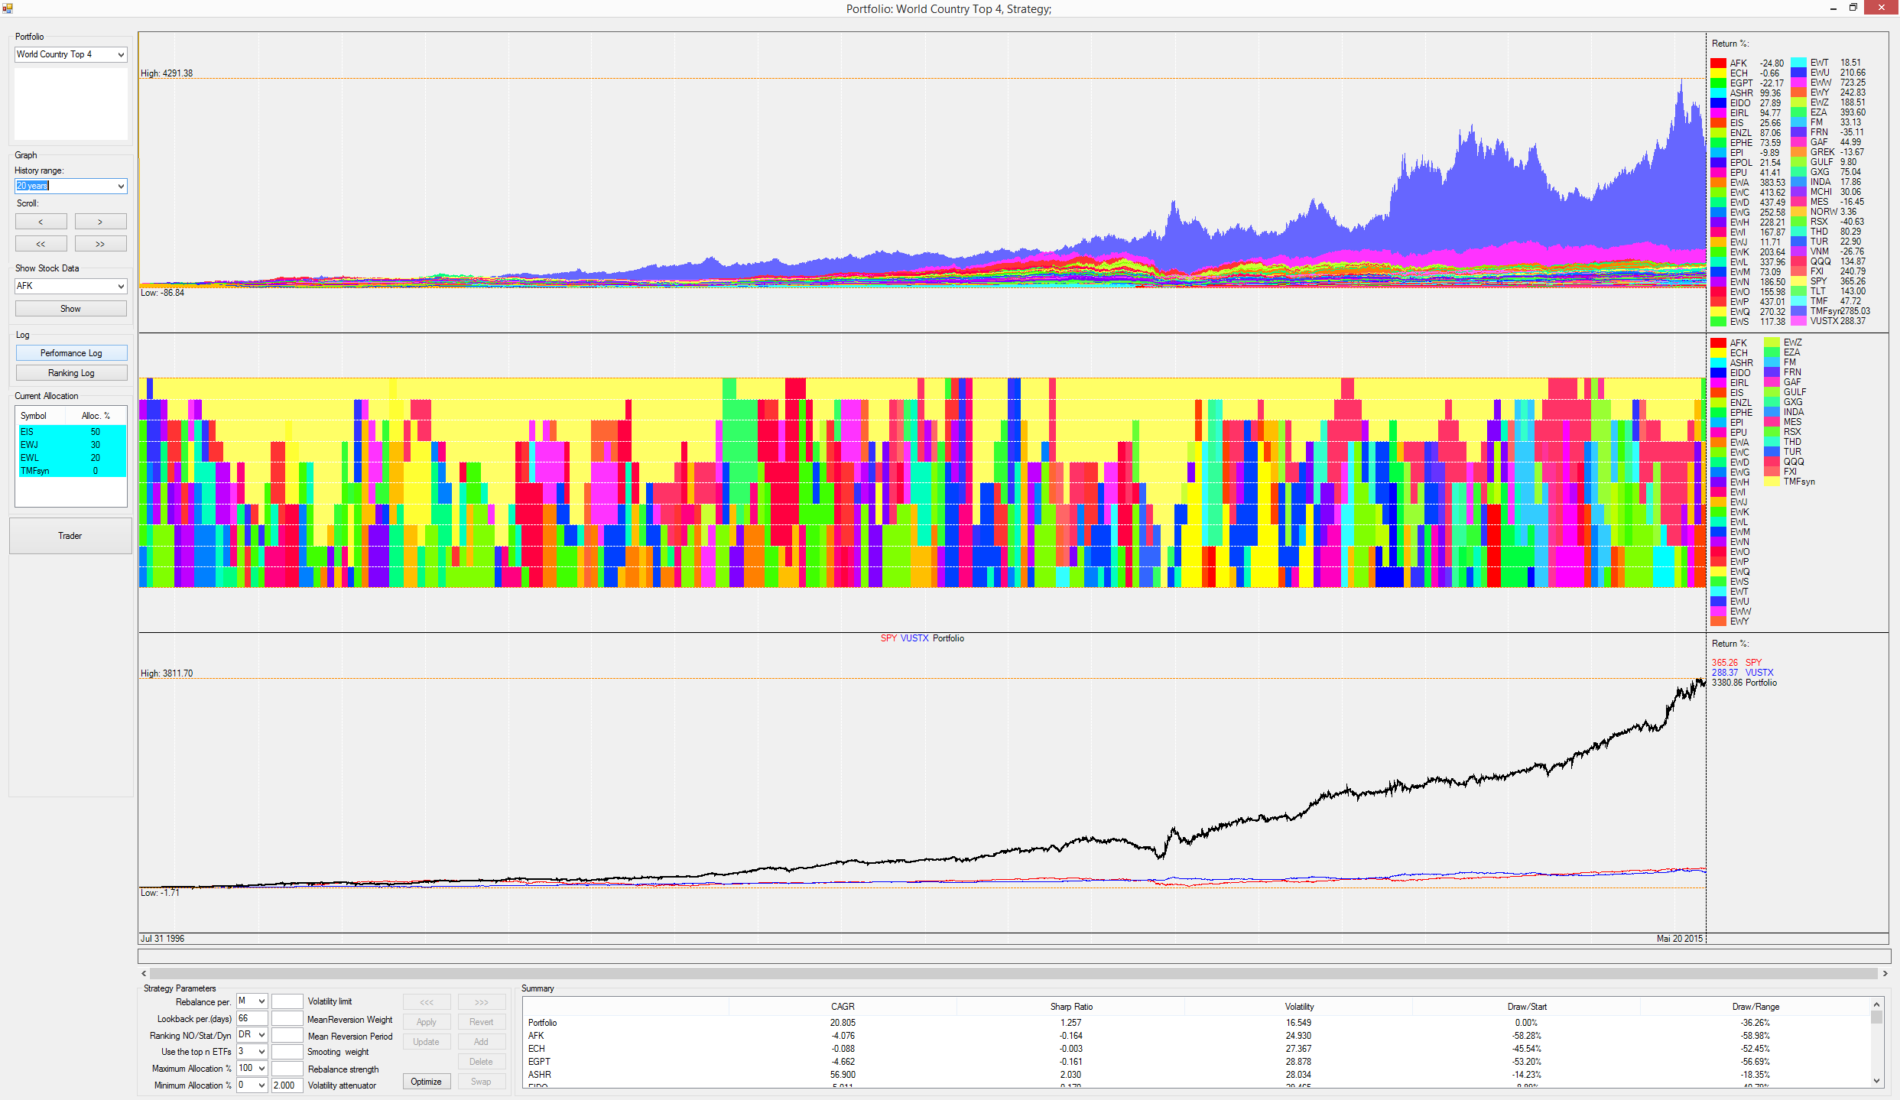
The first backtest was run for the maximum possible duration of 20 years. Only about a third of the ETFs go back to 1996. These include mostly major European countries as well as Japan and Mexico. So for the first 10 years the ETF selection is much smaller than today, but nevertheless the backtest shows that such a country rotation worked well during the last 20 years. I have used the VUSTX mutual fund which is very similar to TLT to construct a synthetic long term TMF ETF.
It is interesting to see, that the strategy always kept a high annual performance of about 20% with a volatility lower than the volatility of an S&P500 investment and considerably lower than an investment in European or Asian stock markets.
|
20 year statistics |
Return |
CAGR |
Volatility |
Drawdown |
Sharpe |
|
Top 4 country |
3380% |
20.8% |
16.5% |
-36% |
1.257 |
|
365% |
8.5% |
20.1% |
-55% |
0.423 |
|
|
VUSTX (TLT) |
288% |
7.5% |
10.8% |
-18% (27%) |
0.692 |
10 year backtest
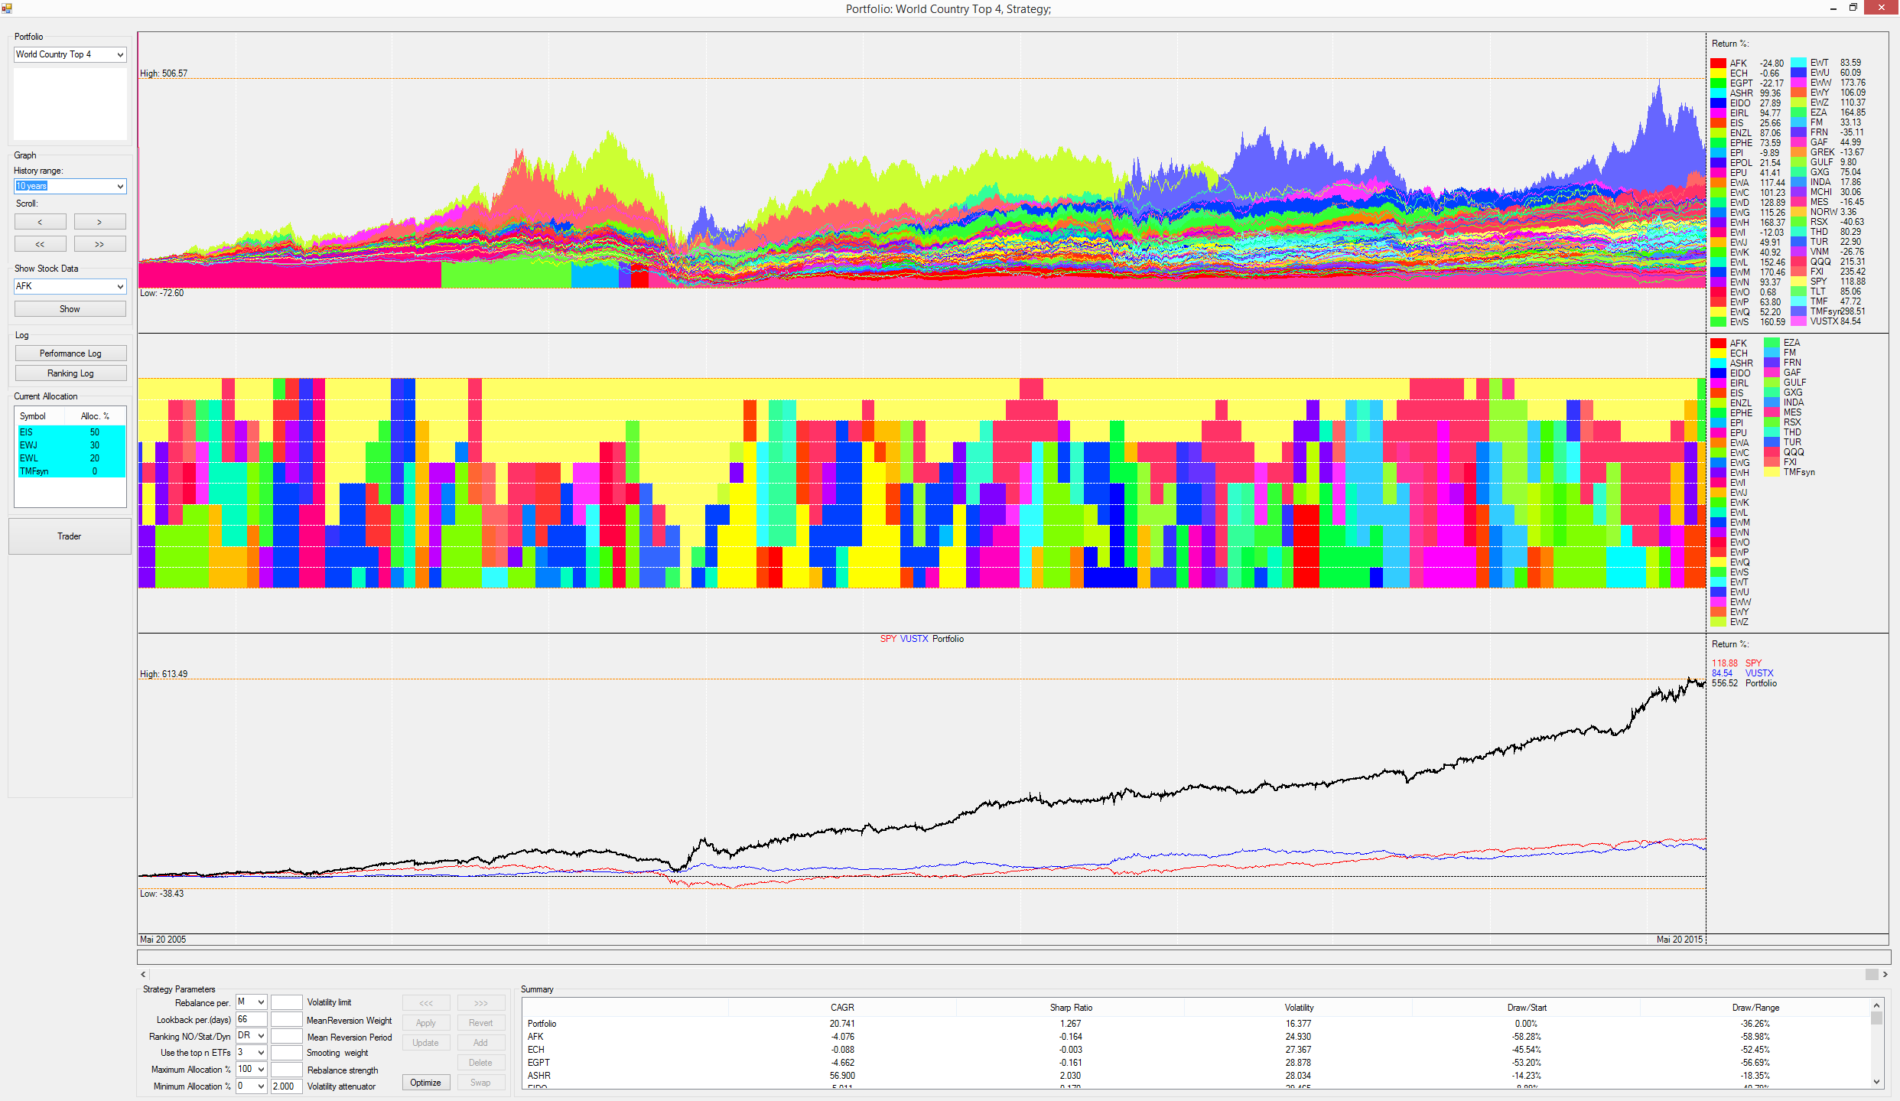
The 10 year backtest uses TLT as the safe haven asset and uses more available country ETFs. The strategy did well during the 2008 crisis. The Sharpe (Return to Risk) ratio of 1.2 is nearly 3x higher than a SPY or TLT investment.
|
10 year statistics |
Return |
CAGR |
Volatility |
Drawdown |
Sharpe |
|
Top 4 country |
556% |
20.7% |
16.4% |
-36% |
1.267 |
|
SPY |
119% |
8.2% |
20.4% |
-55% |
0.401 |
|
TLT |
85% |
6.4% |
14.5% |
-27% |
0.438 |
5 year backtest
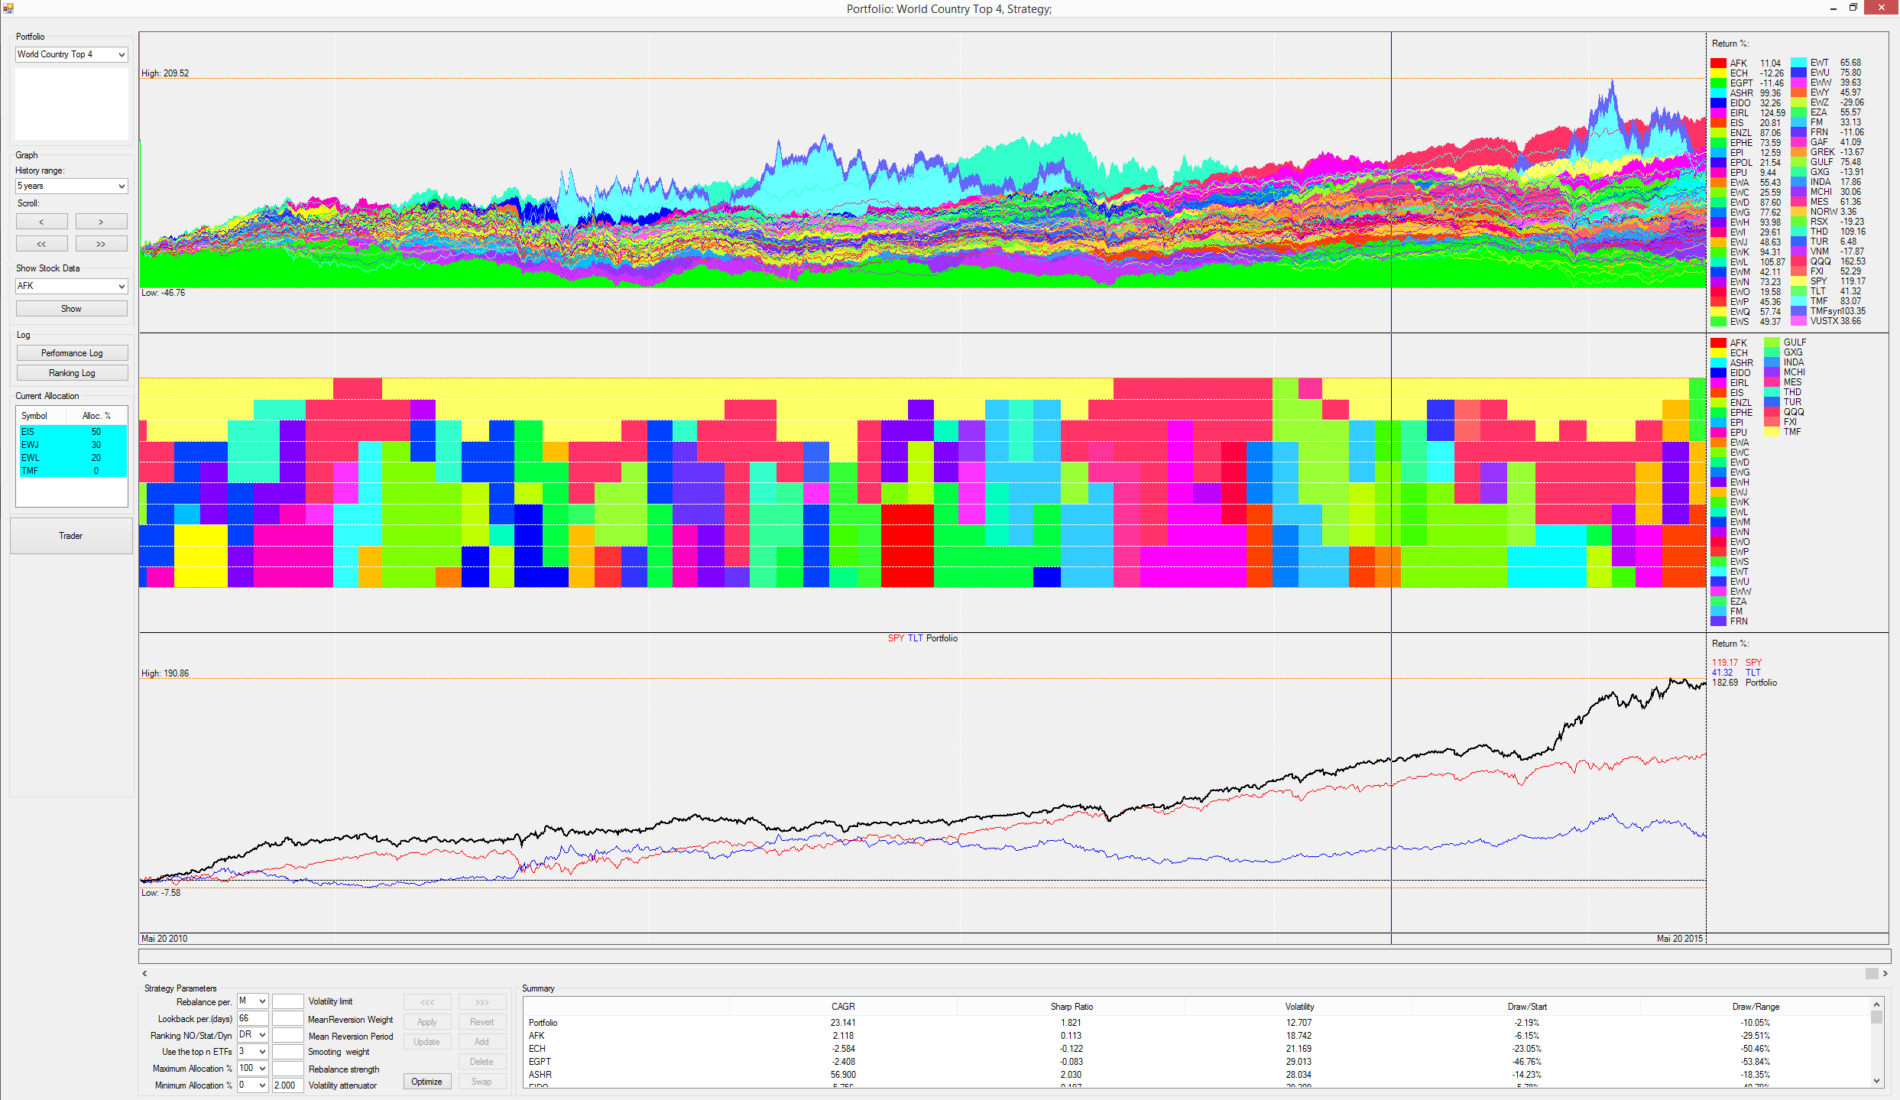
The 5 year backtest has an even higher Sharpe of 1.82 because since the 2008 crisis the long term Treasury (TMF) correlation to the stock market was mostly negative, which allowed to further reduce volatility.
|
5 year statistics |
Return |
CAGR |
Volatility |
Drawdown |
Sharpe |
|
Top 4 country |
183% |
23.1% |
12.7% |
-10% |
1.821 |
|
SPY |
119% |
17.0% |
15.5% |
-18% |
1.098 |
|
TLT |
41% |
7.2% |
15.4% |
-20% |
0.464 |
Year to date backtest
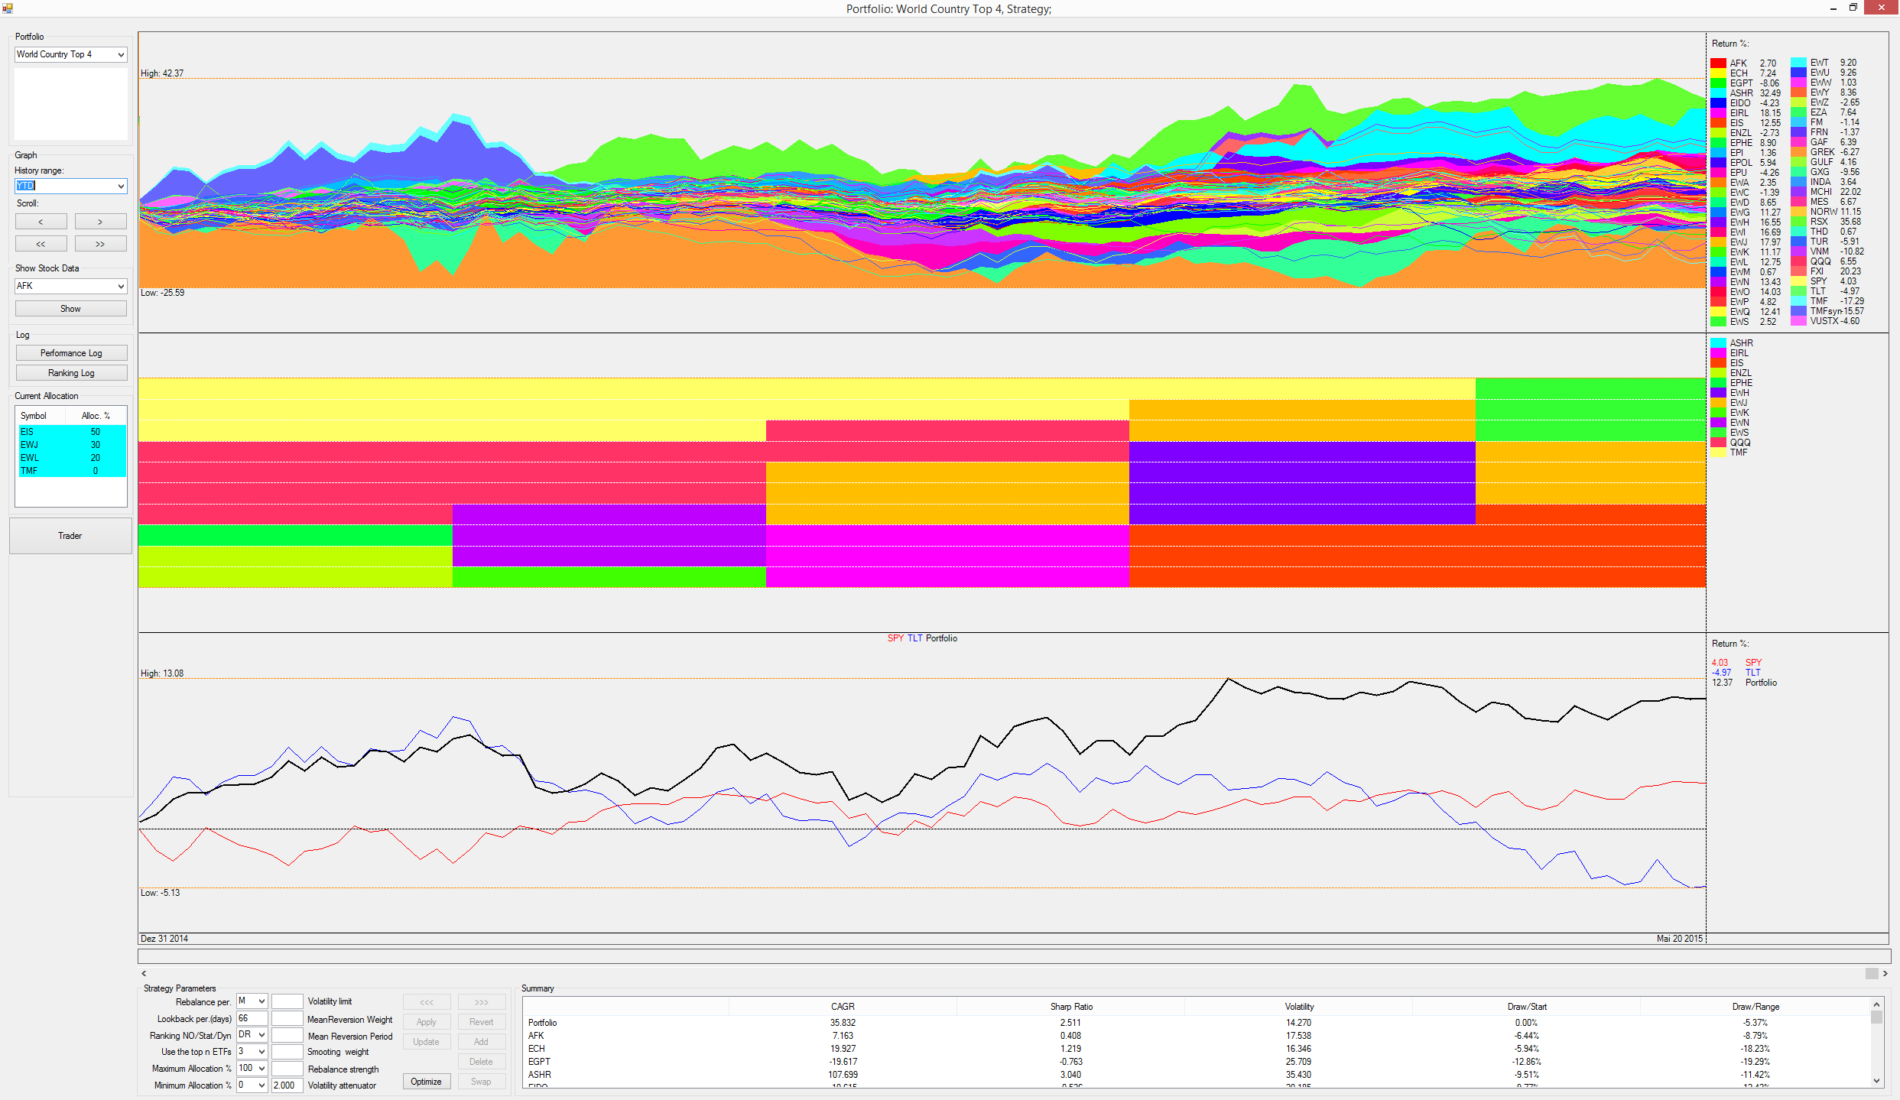
The last backtest is the year to date performance. As you can see the strategy did quite well with a 12.3% performance and at this point it carries no Treasury exposure at all. In other words, presently, it will not be affected by further declining Treasuries due to rising rates.
|
YTD statistics |
Return until May 21 |
CAGR |
Volatility |
Drawdown |
Sharpe |
|
Top 4 country |
12.4% |
35.8% |
14.3% |
-5% |
2.511 |
|
SPY |
4.0% |
10.8% |
12.4% |
-4% |
0.872 |
|
TLT |
-4.9% |
-12.4% |
16.6% |
-14% |
Neg. |
Table of strategy ETFs
|
1 |
Market Vectors Africa Index |
|
|
2 |
Deutsche X-Trackers CSI 300 China A Shares |
|
|
3 |
iShares MSCI Chile Fund |
|
|
4 |
Market Vectors Egypt Index |
|
|
5 |
iShares MSCI Indonesia Index |
|
|
6 |
iShares MSCI Ireland Capped |
|
|
7 |
iShares MSCI Israel |
|
|
8 |
iShares MSCI New Zealand Investable Market |
|
|
9 |
iShares MSCI Phillipines |
|
|
10 |
WisdomTree India Earnings Index |
|
|
11 |
iShares MSCI Poland Index |
|
|
12 |
iShares MSCI Peru Index |
|
|
13 |
iShares MSCI Australia Index Fund |
|
|
14 |
iShares MSCI Canada Index Fund |
|
|
15 |
iShares MSCI Sweden Index |
|
|
16 |
iShares MSCI Germany Index |
|
|
17 |
iShares MSCI Hong Kong Index Fund |
|
|
18 |
iShares MSCI Italy Index |
|
|
19 |
iShares MSCI Japan Index Fund |
|
|
20 |
iShares MSCI Belgium Index |
|
|
21 |
iShares MSCI Switzerland |
|
|
22 |
iShares MSCI Malaysia Index Fund |
|
|
23 |
iShares MSCI Netherlands Index |
|
|
24 |
iShares MSCI Austria Index |
|
|
25 |
iShares MSCI Spain Index |
|
|
26 |
iShares MSCI France |
|
|
27 |
iShares MSCI Singapore Index |
|
|
28 |
iShares MSCI Taiwan Index Fund |
|
|
29 |
iShares MSCI United Kingdom Index |
|
|
30 |
iShares MSCI Mexico Index Fund |
|
|
31 |
iShares MSCI South Korea Index Fund |
|
|
32 |
iShares MSCI Brazil Index Fund |
|
|
33 |
iShares MSCI South Africa Index |
|
|
34 |
iShares MSCI Frontier Markets ETF |
|
|
35 |
Guggenheim BNY Mellon Frontier Mkts |
|
|
36 |
iShares FTSE China 25 Index Fund |
|
|
37 |
SPDR S&P E.M. Middle East & Africa |
|
|
38 |
WisdomTree Middle East Dividend Index |
|
|
39 |
Global X FTSE Greece 20 |
|
|
40 |
Global X Interbolsa FTSE Colombia 20 |
|
|
41 |
Market Vectors Indonesia |
|
|
42 |
iShares MSCI China Index |
|
|
43 |
Market Vectors DJ Gulf States (GCC) Titans |
|
|
44 |
Global X FTSE Norway 30 ETF |
|
|
45 |
PowerShares Nasdaq-100 Index |
|
|
46 |
Market Vectors DAXglobal Russia |
|
|
47 |
iShares MSCI Thailand Index |
|
|
48 |
iShares MSCI Turkey |
|
|
49 |
Market Vectors Vietnam |
|
|
50 |
Direxion 3x leveraged 20-yr Treasury |


