
The US Petroleum Trade Balance
As oil prices start heading up, the usual questions arise regarding the macro implications. One view is that with the revolution in tight oil production, the US will experience less of a negative impact than before. This conclusion relies on a set of assumptions, possibly including the US being substantially less dependent on oil imports. Is this true?
(Click on image to enlarge)
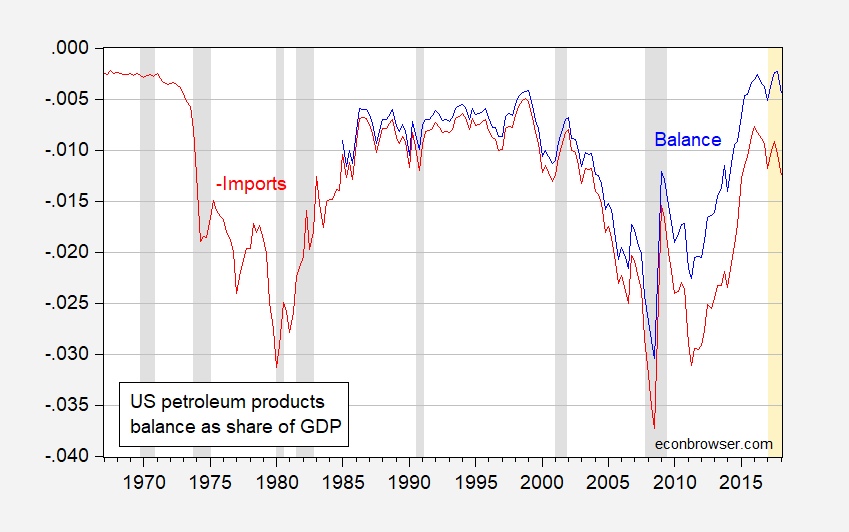
Figure 1: US petroleum trade balance (blue), and negative of US petroleum imports (red). NBER defined recession dates shaded gray. Source: BEA, 2018Q1 advance release, NBER, author’s calculations.
Notice that the petroleum trade balance (as a share of GDP) is roughly the same as it was in 1999, and in 2017Q1. If the price of oil should increase, then in the short term this would result in a larger nominal oil deficit. Over the longer term, higher oil prices would spur domestic production while reducing domestic consumption, tending to accelerate the US move to a net oil exporter (in real terms at least); see EIA’s Annual Energy Outlook, 2018 (Feb. 2018).
The nominal petroleum products balance conflates quantity and price changes. In some ways, we want to know what is happening to the volume of the balance. In chained quantities of petroleum products, the real petroleum deficit is shrinking.
(Click on image to enlarge)
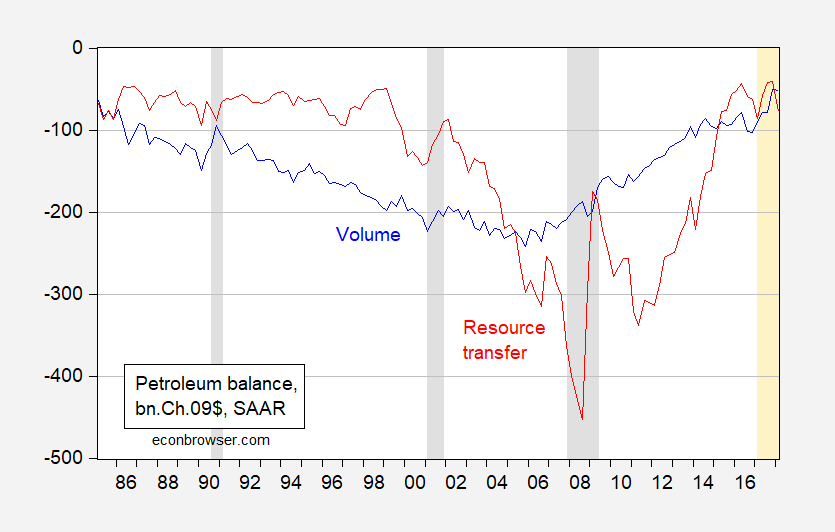
Figure 2: Volume measure of petroleum trade balance (blue), real value of petroleum trade balance in Ch.2009$ of GDP. NBER defined recession dates shaded gray. Source: BEA 2018Q1 advance release, NBER, and author’s calculations.
In terms of what resources are being transferred via a petroleum trade deficit, the series is increasing as oil prices rise. That is because the petroleum products balance remains in deficit. Further notice that because the US exports a good deal of refined petroleum products, while importing primarily crude, then petroleum terms of trade (price of petroleum exports to petroleum imports) is not constant; rather it tends to rise as crude prices rise.
(Click on image to enlarge)
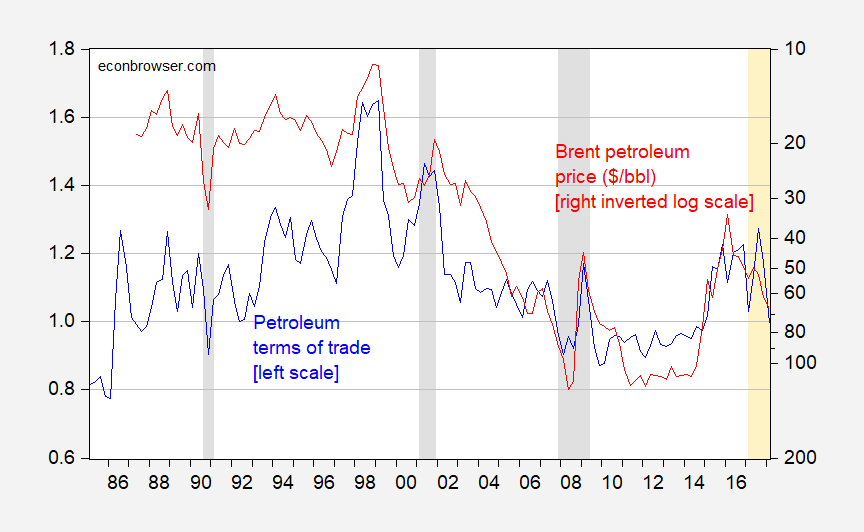
Figure 3: Price deflator for petroleum exports divided by price deflator of petroleum imports (blue, left scale), price of Brent crude oil (red, right inverted log scale). Source: BEA 2018Q1 advance release, US EIA via FRED, NBER, and author’s calculations.
Hence, should oil prices rise substantially, the initial impact will to be to effectuate a transfer to the rest-of-the-world. Crude oil futures for Brent are already rising in the wake of MidEast political tensions, so one should expect some short term deterioration in the balance.
(Click on image to enlarge)
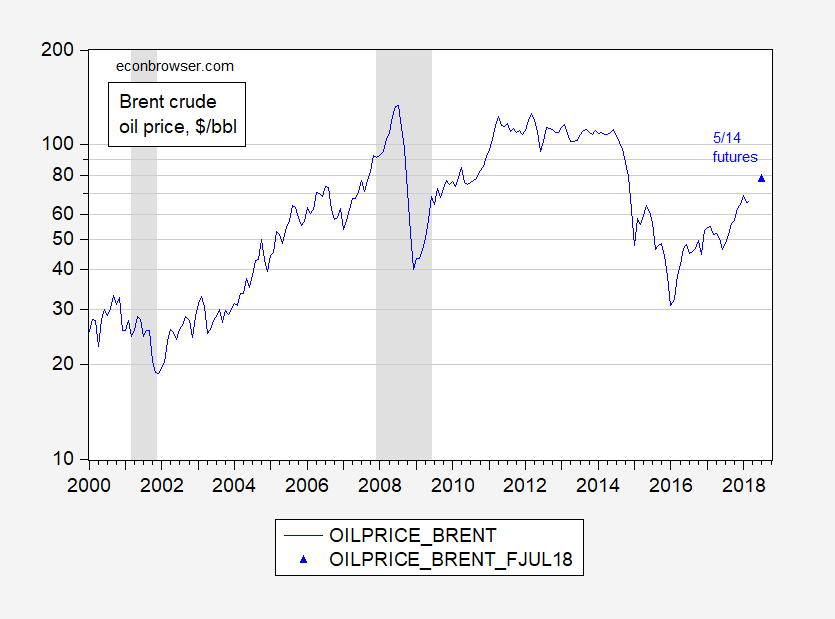
Figure 4: Brent crude oil price, $/bbl (blue, on log scale). Observation for July is futures as of 5/14. NBER defined recession dates shaded gray. Source: FRED, INO.
In general, it’s still likely true that with the US being a larger producer than in the past, the boost to domestic producers and ancillary suppliers will likely mitigate the negative effect from the transfer, and hit to consumer budgets, as noted by Jim in his analysis of the modest boost from the 2014 collapse in oil prices. (A sharp boost in oil prices is, as Jim notes, a different matter).
Disclosure: None.


