
The S&P 500 Is Just 2% From Its Record
Stocks Inch Closer To A New Record
The S&P 500 was up 0.22% to 2,815.62 on Wednesday. Each point the S&P 500 increases is technically important because it is so close to a new record high. Just because I think it will breakout because earnings growth is strong and other indexes such as the Russell 2000, S&P 400, and the Nasdaq are at records, doesn’t mean this record is a foregone conclusion. The strong dollar, weakness in the financials’ traditional business, and the potential for the American economy to follow the global weakness could come together to cause there to be a dreaded double top. The Dow was up 0.32%. It is on a 5-day winning streak. If you look at the past 5 years of data where the Dow was up 5 days in a row, the Dow was up the next day 72% of the time and it was up in the next 5 days 84% of the time. The Dow has been a laggard index as it needs to rally over 5% to get to a new high.
The stock market is slightly overbought which signals it should still have room to break a new record. The CNN Fear and Greed index is 56 out of 100 and the 14 day RSI is at 53.58. The modest grind higher is working. The S&P 500 is up 3.58% month to date, but it doesn’t seem like there is euphoria like there was in January as investors are worried about the yield curve. The amazing run since the November 2016 election caused that euphoria in January. To be clear, the market can top without that level of euphoria, but when optimism gets that high, it’s bad news technically.
The financial sector was helped by Morgan Stanley’s great earnings as it increased 1.53%. The worst sector was consumer staples which was down 0.65%. Leading up to today, the consumer staples sector has been on fire. It was up 8.06% from May 3rd to Tuesday. When the S&P 500 was near the low end of this range, I said it needed the consumer staples and the financials to get to a new record. It has gotten their help and is within striking distance of a new record. The industrials sector was up 1.13% as it was helped by the amazing performance of CSX stock which I will review later in this article.
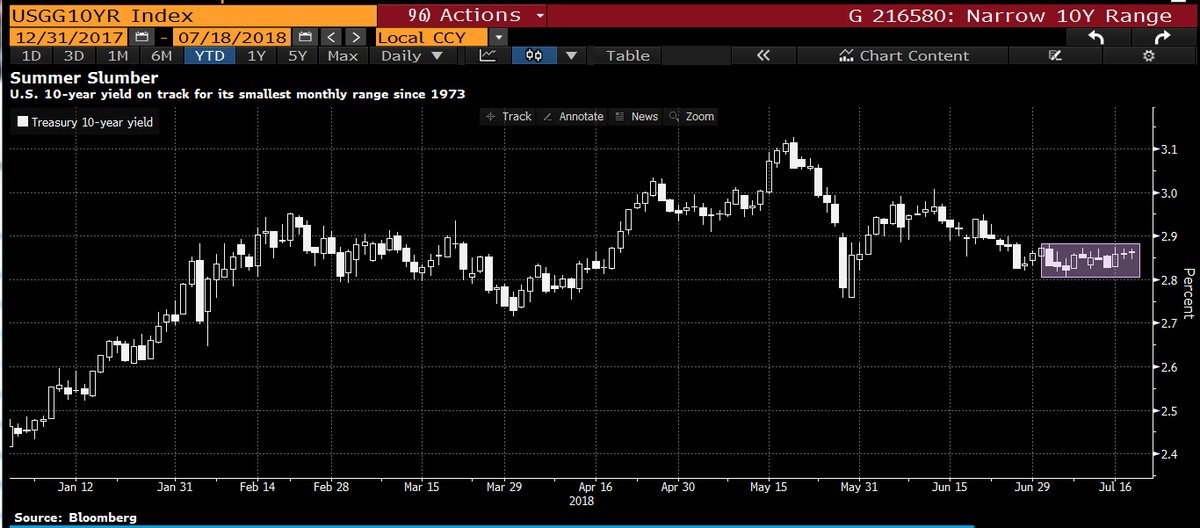
Treasuries Very Narrow
The 10-year yield was up slightly on Wednesday during the stock market trading session. It was up in the afternoon after the close as the latest yield is 2.8802%. The 2-year yield was down slightly during the day and up slightly in the afternoon. The latest yield is 2.6113%, making the difference between the two yields about 27 basis points. This latest steepening adds slight momentum to the financial stocks. As you can see from the chart below, the 10-year treasury yield has traded in the narrowest range for a month since 1973. According to technical analysis, tight ranges can be like slinkies which coil up and then explode. If I had to guess, I’d expect the 10-year yield to fall rather than rally because year over year inflation is about to peak in August and growth should decelerate slightly in the second half. Any sizable decline would cause the curve to invert.
(Click on image to enlarge)
CSX Reports Good Q2 Earnings
CSX stock was up 7.08% on Wednesday as it hit an all-time high; it was one of the best performers in the S&P 500. Dow theory suggests the transports are leading indicators for the economy since they tell us how much commerce is happening. CSX’s good earnings suggest the economy is doing well.
Its EPS was $1.01 which beat estimates for $0.87. This was a 58% increase from last year. The revenue of $3.1 billion beat estimates for $3 billion. There was a 2% increase in shipping volume which beat estimates for 0.9%. To be clear, these were good results, but the main driver was the decline in the corporate tax rate. Don’t listen to the management team which understandably wants to claim the business is doing all the work because that would help the stock more. The effective corporate tax rate declined from 38.1% to 23.5%. The 6% reduction in shares outstanding also helped EPS growth.
The Foreseen Recession
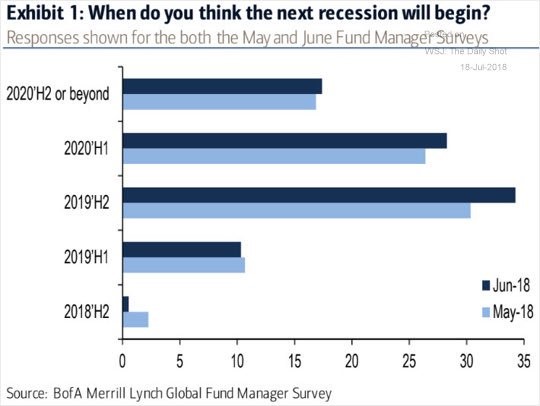
Because this cycle has been so long, I can’t say I have much experience with late cycle economies. I started investing in 2007 with little understanding of how cycles worked. That being said, the next recession seems widely foreseen, unlike the financial crisis which caught most participants by surprise. My idea, which came into fruition about 8 months ago, that there would be a recession around the year 2020 has become the consensus. The chart below shows the fund manager survey which asks them when the next recession will occur. In a previous chart, the answers were broken down into halves for 2019, but 2020 was one answer. Now we have a better chart because it includes the first half of 2020 as an option by itself.
In June we were nearing the second half and there was no inkling of a recession. Therefore, the percentage saying one will occur then has fallen from May to June. The most common answer is the second half of 2019 and the second most common answer is the first half of 2020. Combined, about 65% said there would be a recession in either period. A recession happens about 21 months after yield curve inversions on average. If the inversion occurs in October 2018, that would mean the next recession would be in mid-2020. This is just an estimate. For all we know, the yield curve could be wrong.
(Click on image to enlarge)
Conclusion
It’s interesting to see the distinction between the current earnings reports and how almost everyone thinks a recession will occur in the next 1-3 years. CSX just reported good results, but fears of a yield curve inversion make most money managers think this bull run is very close to ending.
Disclaimer: Neither TheoTrade or any of its officers, directors, employees, other personnel, representatives, agents or independent contractors is, in such capacities, a licensed financial ...
more

