
The Market Continues To Trend Higher As Confirmed By The Bullish Percents
In the short-term, the market continues to trend higher as confirmed by the bullish percents.
(Click on image to enlarge)

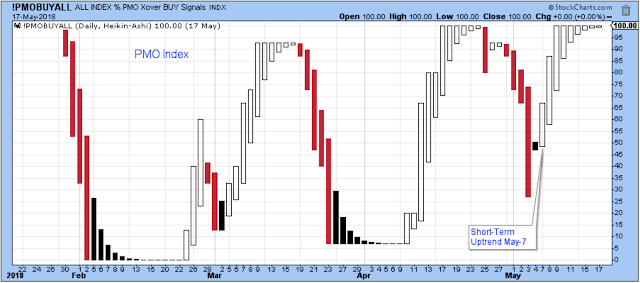
The PMO Index also continues to confirm the uptrend, although it is at the top of its range, and this is where I start to get cautious about any new purchases. Once this index posts a red bar, that is when I start to look for signs that a new short-term downtrend is starting, and when I begin looking for opportunites to trim holdings and take partial profits.
(Click on image to enlarge)
Sentiment
The Investor's Intelligence Newsletter Sentiment Survey is showing about 46% bulls as reported by VIX-Squared on Twitter. This is generally in the range in which the market is able to launch significant rallies. From a contrarian's point-of-view, the current level of bullishness in this survey favors higher stock prices.
I highly recommend paying attention to the Investor's Intelligence weekly survey. It has served me well for a long time. It isn't perfect and doesn't always work, such as during extremely strong or weak market trends. But, most of the time, it provides very helpful market timing signals.
In general, when the number of bulls is below 45%, it favors a period of higher stock prices. When the percent of bulls rises above 55%, it is in an indication that bullishness is starting to become excessive which works against stock prices.
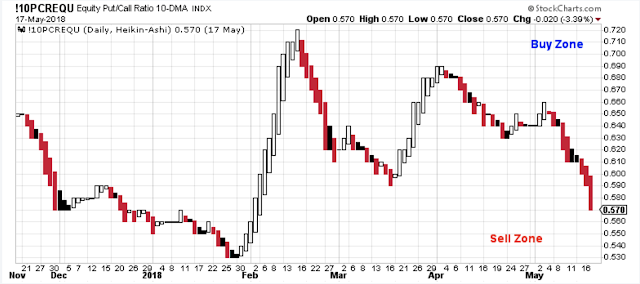
The 10-day put/call ratio is starting to reach down towards a level where the market starts to struggle a bit.
I consider this to be more of a short-term indicator whereas the Sentiment Survey is more of a medium-term indicator.
(Click on image to enlarge)
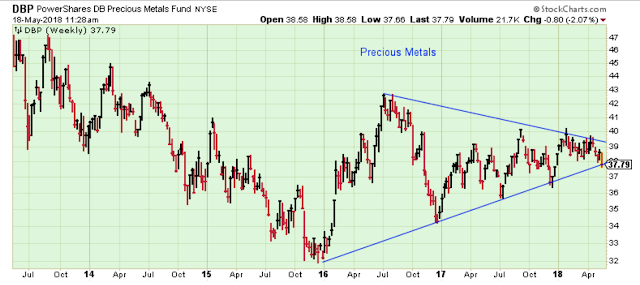
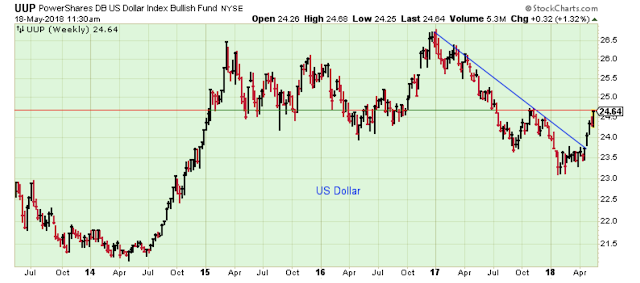
Commodities, Currencies
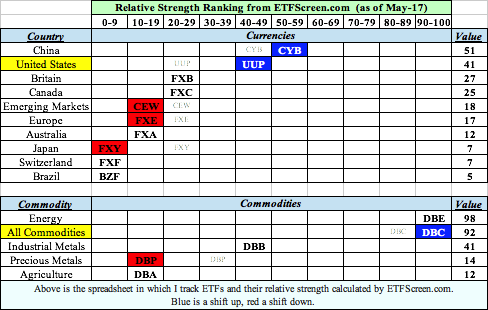
Below is the spreadsheet I use to help track the relative strength of the various areas of the general market. Blue is a shift higher, and red is a shift lower.
In this spreadsheet I see strength in the US Dollar, and weakness in most other currencies. This indicates to me that the US is raising rates faster than most other countries, and it is a signal to avoid foreign ETFs.
The strong dollar (and weak precious metals) calls into question whether the rising price of oil is sustainable. It seems rare to see Energy so strong while rates are rising rapidly and the US Dollar is so strong.
What does it mean? I don't know for sure, but I think it would be wise to view Energy holdings as temporary, and that they should be sold if the trend in oil breaks down.
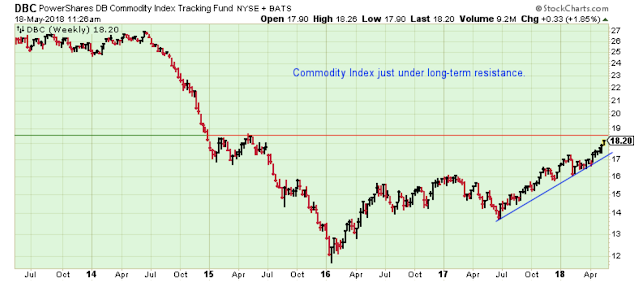
(Click on image to enlarge)
(Click on image to enlarge)
(Click on image to enlarge)
(Click on image to enlarge)
Regarding the general stock market, here is a quotation from IBD.
"News continues to be a force in the stock market, and a news-driven market is generally an unsure market. Bulls much prefer to see earnings and stock fundamentals drive the market action." IBD, May-18-2018
Outlook Summary:
The market is looking good right now, but I am nervous about the insane Federal deficits and the negative impact of higher yields on stock prices.
I am also nervous about the headlines swirling around the White House. The news keeps getting worse, and it just seems like a matter of time before one of these headlines gets close to the man at the top.
The long-term outlook is cautious.
The medium-term trend is up as of May-10.
The short-term trend is up as of May-7.
The medium-term trend for bond prices is down.
Disclaimer: I am not a registered investment advisor. My comments above reflect my view of the market, and what I am doing with my accounts. The analysis is not a recommendation to buy, ...
more

