
The Growth Rate Of S&P 500 Dividends Per Share In The 21st Century
One of the most important and perhaps least well known metrics for the U.S. stock market is the growth rate of dividends for the S&P 500. We thought it was long past time to give this particular data series its due by visualizing the year over year growth rate of the S&P 500's trailing year dividends per share for each month of the 21st Century, starting from the beginning of the last year of the 20th Century and continuing through March 2018, with a bonus projection of the currently expected future for S&P 500 dividend growth through March 2019.
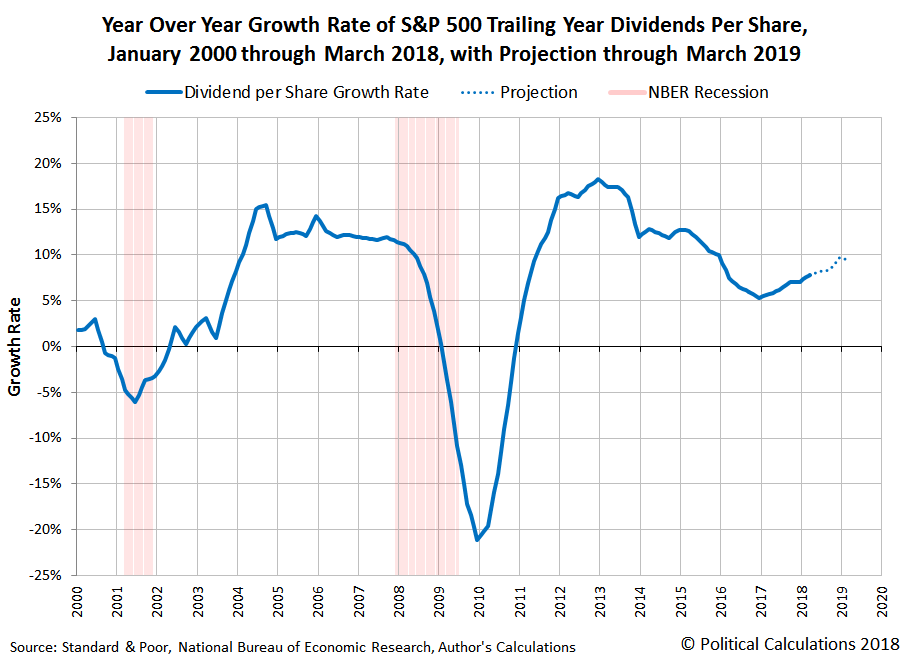
We've also indicated the National Bureau of Economic Research's official periods of recession in the 21st Century (so far!) on the chart.
As for how to best use this data, you really want to pay close attention to how fast the growth rate of dividends per share is changing, where negative accelerations for dividends generally coincide with falling stock prices, and positive accelerations tend to coincide with rising stock prices.
Disclaimer: Materials that are published by Political Calculations can provide visitors with free information and insights regarding the incentives created by the laws and policies described. ...
more

