
The Good News…
After a sharp decline in the stock market last week, investors were once again awakened to the reality that stocks are called risk assets for a reason… sometimes they go down. The reason why stock investors have been well compensated over the years, is because they have to put up with these types of volatile events from time to time. Nonetheless, I know the financial media will be quick to dwell on all the negative aspects of last week’s action. However lets take a look at the good news.
- Dividend Yields have increased.
(Click on image to enlarge)
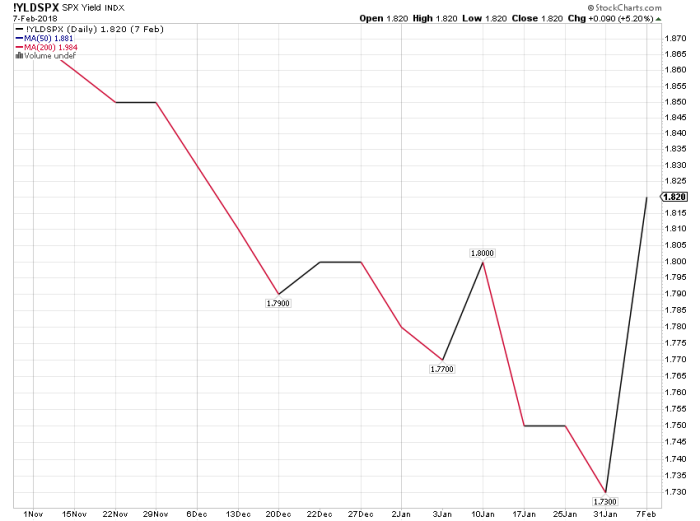
Dividend yields have an inverted relationship to price. As the price of a stock or index (S&P 500) rises, the amount of the dividend (in percentage terms) decreases. And vice versa.
The chart above is the dividend yield on the S&P 500 index. We hit a low of 1.73% as the market topped out in January. After the decline, the dividend yield has increased to 1.82, a 5% increase.
2.Valuations have gotten cheaper
(Click on image to enlarge)
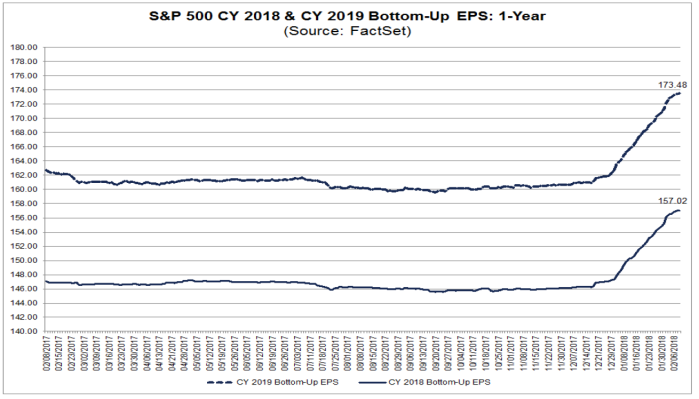
Earnings Per Share (EPS) projections for the S&P 500 companies in 2018 and 2019 have risen sharply in the last two months. The 2018 estimates were for $146 per share in December and are now $157.02 per share. An increase of about 7.5%. The 2018 earnings growth estimates are nearing 20%.
(Click on image to enlarge)
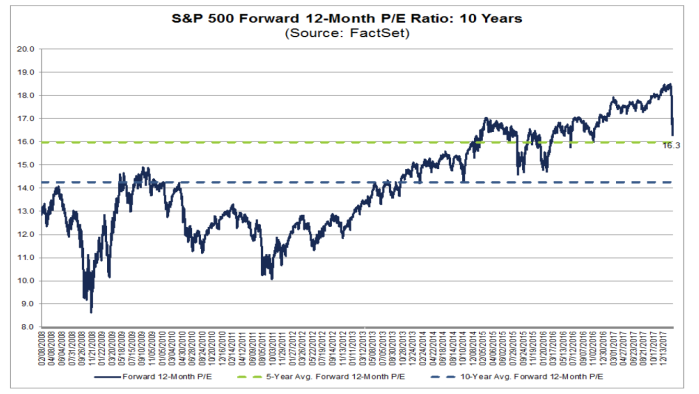
So the increase in the earnings estimates coupled with the decline in the price of the index has culminated in a decrease in the valuation investors are paying for those earnings. Before the decline investors were paying almost 19x 2018 earnings. Now investors paying 16.3x for 2018 earnings, which is closer to the historical average. Especially given the low inflation, low interest rate environment we are in.
Investors are paying 16.3x forward earnings when earnings growth is projected to be close to 20% for the year. And interest rates are still below 3%, at least for now. That’s a pretty enticing offer.
3. The correction has almost equaled the 2015-2016 decline.
(Click on image to enlarge)
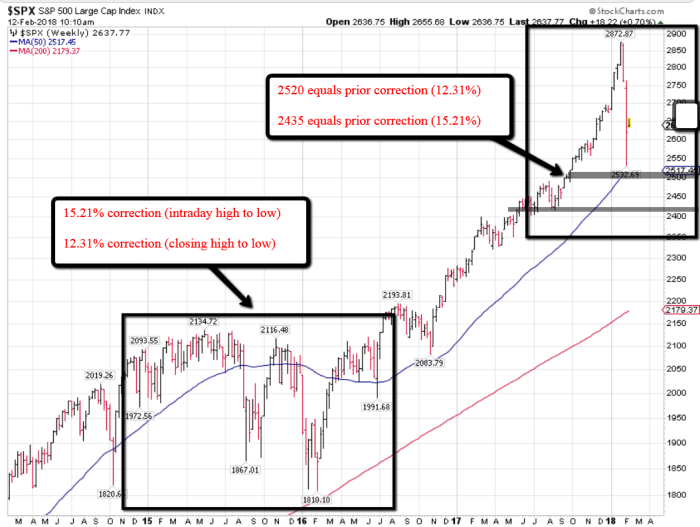
In 2015, the stock market experienced a correction of about 12% and then proceeded to get off to the worst start to a year ever recorded in 2016. The total combined correction was about 12.31% on a closing basis, and 15.21% on an intra-day basis.
If we project that from the all time highs hit earlier this year, potential support should be in the area of 2519 and 2435 on the S&P 500. We got close to that level on Friday and have bounced back a bit since then. It’s possible that the market may be “scrapping bottom” in terms of the Friday low. Further downside appears limited even though this bottoming out process could likely take time. This correction will setup the next leg higher.
4. Largest volume amounts have come on the up days
(Click on image to enlarge)
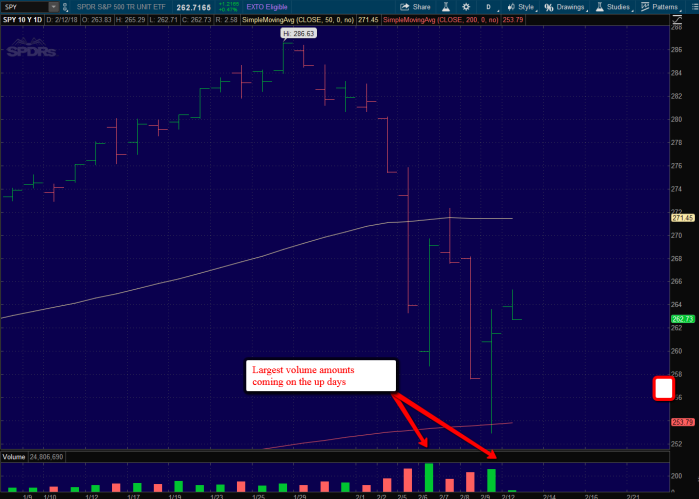
The chart above is the S&P 500 index ETF, the most liquid and popular fund used to track the S&P 500. As you can see, the days with the most amount of volume have come on the two days that the market has closed higher.
I take this as a positive because you often see the reverse during corrections. The down days are usually accompanied by higher volume totals. Not this time. At least not yet.
5. “Black Monday” 1987 was the buying opportunity of a lifetime!!!
(Click on image to enlarge)
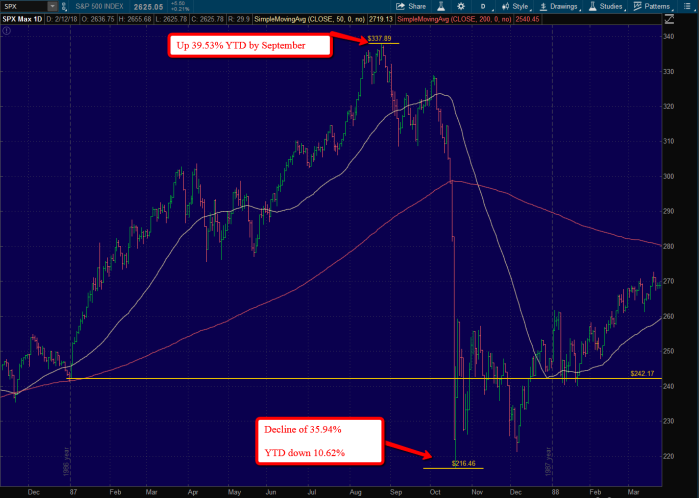
No two situations are ever truly alike. But the pace of last week’s decline surely brought up comparisons to the 1987 stock market crash. The 1987 crash was the only technical bear market that wasn’t accompanied with an economic recession in the post WWII period. A bear market is highly unlikely without an economic recession, but there is always a slight chance. However if we really look at what happened, and it’s aftermath, my hope is that by facing our fears we can learn from them.
The above chart shows the daily price action in the S&P 500 index in 1987. The index had been rising sharply, showing a year to date gain of 39.5% by September! So the crash came sharp and fast, a 36% decline which came mostly during the last 3 days. But the year to date decline maxed out at 10.62%, which isn’t out of the ordinary. In other words, the market got way ahead of itself and had to readjust.
I can’t imagine what that must have felt like. There is no way to not let such a steep decline bother you. But we do have a choice of how we react to those emotions.
In this case the decline was short lived and presented the buying opportunity of a lifetime.
(Click on image to enlarge)
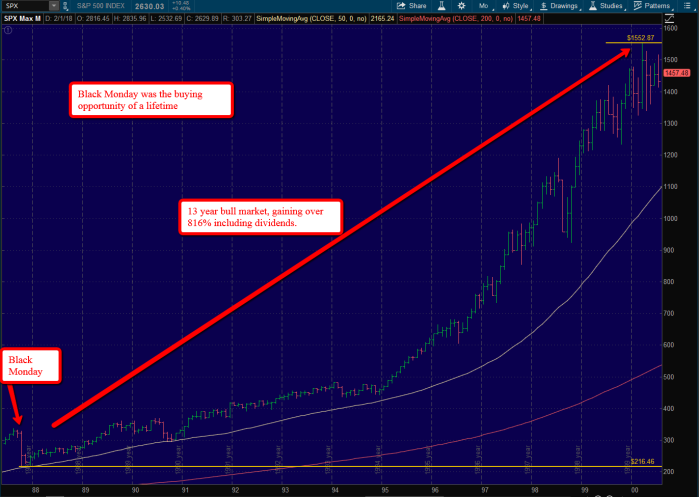
The chart above shows what happened after the 1987 crash. The crash is barely visible. It kicked off one of the biggest bull markets in history from 1987 to 2000. Resulting in a total return of about 816%.
The emotions were real. But as long as you didn’t panic, you made out well.
Summary: Corrections and volatility are a typical part of the market cycle. What happened in 2017 isn’t the norm. We experienced a rising market without anything more than a 3% correction for almost 2 years. And now we are making up for lost time.
The financial markets are adjusting to the new reality of a stronger global economy. Yes rates are starting to rise, but it’s for good reasons. Sooner or later the market will realize this. In the mean time, investors should try to remain as balanced as possible. Not getting too high when things are good, and too low when things turn down.
It’s very unlikely that a significant bear market will occur. But even it if does, as we saw in 1987, it would likely be short lived and setup a strong rally.
Disclosure: None.
Nothing on this article should be misconstrued as investment advice. Trading and investing is very risky, please consult your investment advisor before making any ...
more

