
The Expected Future For S&P 500 Dividends
A story for investors in a single chart: the quantified expectations of the S&P 500's future dividends per share, as projected 2017-Q2 through 2018-Q2, as told by two different sets of dividend futures.
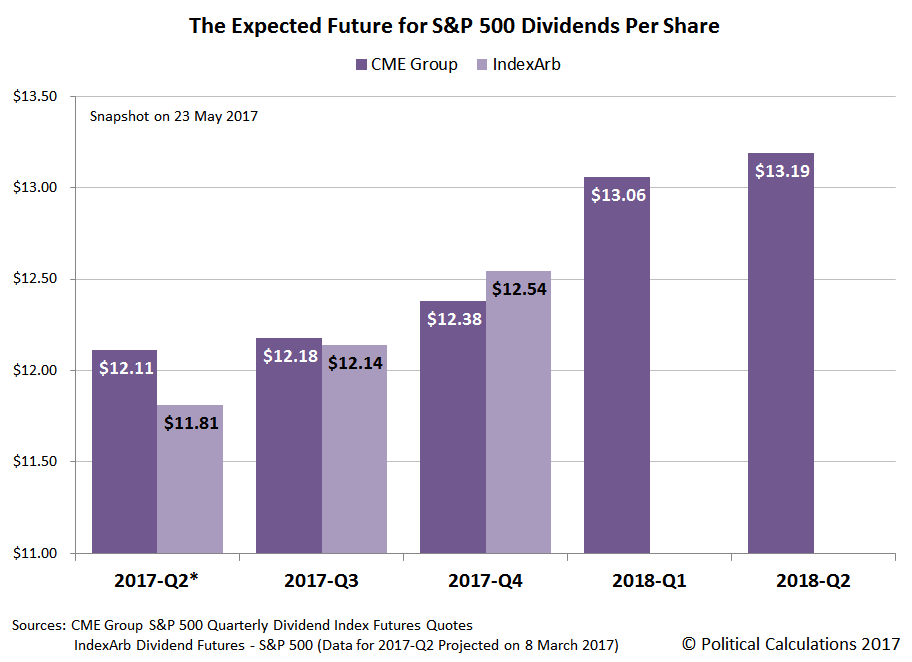
The story is told by our two main sources for information about the expectations of future dividends for the S&P 500: CME Group and IndexArb. Here are some quick notes about the data....
- IndexArb uses a "bottoms-up" approach to estimating the dividends per share of the S&P 500 index, built up from the projected cash dividend payments projected for each of the index' dividend paying component firms after accounting for each firm's market capitalization. The CME Group's projected dividends are produced through a more "top-down" approach, where the trading of options contracts linked to future S&P 500 dividend payouts sets the projected dividend per share level for future quarters extending out through the current and next four quarters.
- The "quarters" for both sources run from the end of the third Friday of the month ending the previous quarter through the end of the third Friday of the month ending the indicated quarter. As such, the data reported for both sources will not match with the quarterly dividend data reported by Standard and Poor for the S&P 500, since S&P follows regular calendar quarters when reporting dividends per share for the index.
- Because of that term mismatch, S&P's reported dividends and the dividend futures will tend to greatly differ from each other for the data that applies to the last quarter of the year and to the first quarter of the next year. This apparent discrepancy arises because a number of firms that pay annual dividends will pay them out during the last week of the year, or in the case of firms that pay variable dividends, where they'll pay their largest dividends of the year during that last week, with both dividend paying strategies affected by tax considerations. Where dividend futures are concerned, that mismatch in the terms covered by a quarter will most often make Q4 dividends appear low and Q1 dividends appear high compared to the S&P's "official" dividends per share accounting.
- IndexArb's dividend futures data follows a cumulative payout approach, where the value for each indicated quarter represents the projected total dividends per share that will be paid out between the current day and the third Friday of the month ending the indicated quarter. Values for the actual dividends per share can be calculated by taking the indicated dividends per share that apply for the quarter of interest and subtracting the indicated dividends per share for the preceding quarter. For the current quarter, the last time that math can be done is on the last day that the value of dividends per share remaining to be paid out in the preceding quarter is reported. In the chart above, the projection for IndexArb's 2017-Q2 dividends per share was made on 8 March 2017.
- Since the CME Group's dividend futures data continues all the way through the expiration of the quarter's options contracts, changes can continue to be observed for that stream of data, which is why we use it in our long-running S&P 500 forecasting project. We had previously used dividend futures data provided by the Chicago Board of Exchange in our project, but they opted to discontinue their reporting at the end of April 2017.
Disclosure: None.
How did you like this article? Let us know so we can better customize your reading experience.

Comments
Leave a comment to automatically be entered into
our contest to win a free Echo Show.

