
The Evolution Of U.S. Agricultural Exports
from the St Louis Fed
-- this post authored by Alexander Monge-Naranjo and Hee Sung Kim
It is well known that the U.S. economy is a major supplier of food products to the world. Not only is the country endowed with fertile lands and natural resources, but it also has the appropriate climate for grains and grass. In addition, it has developed the know-how, equipment, advanced production technologies and skilled workers for key agricultural sectors.

Just in 2016, according to Food and Agriculture Organization Corporate Statistical Database, the U.S. produced:
- 117 million metric tons of soybeans
- 384 million metric tons of maize (corn)
- 62 million metric tons of wheat
Where do these agricultural products go? Have there been changes of relevance in the direction of exports?
Patterns in U.S. Soybean, Corn and Wheat Exports
Here, we will review the dramatic changes in the direction of the exports of three of the main agricultural goods produced in the U.S. Our analysis includes the early 1990s - before NAFTA (1994) and way before China joined the World Trade Organization (2001) - and the most recent years.
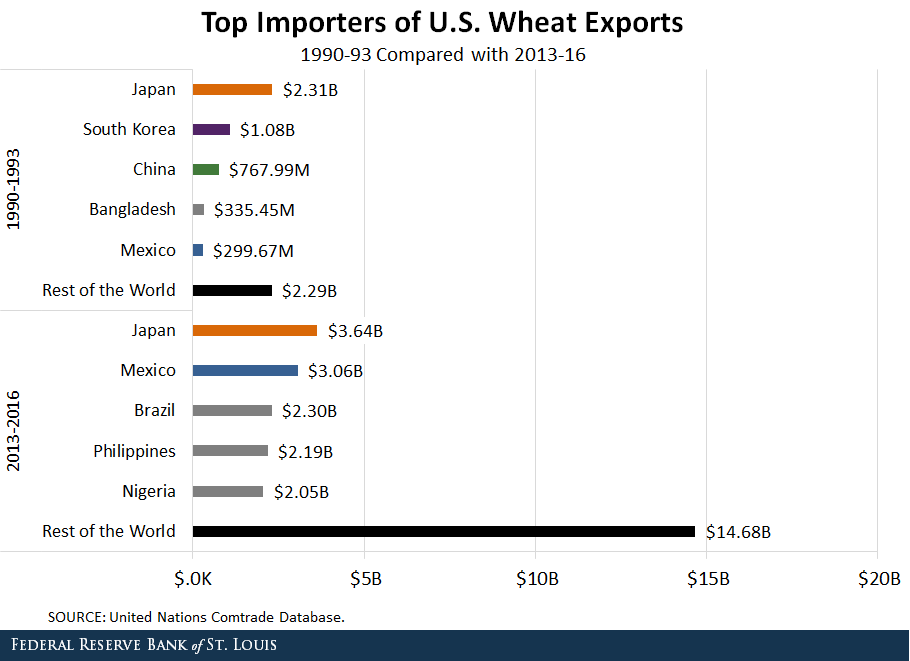
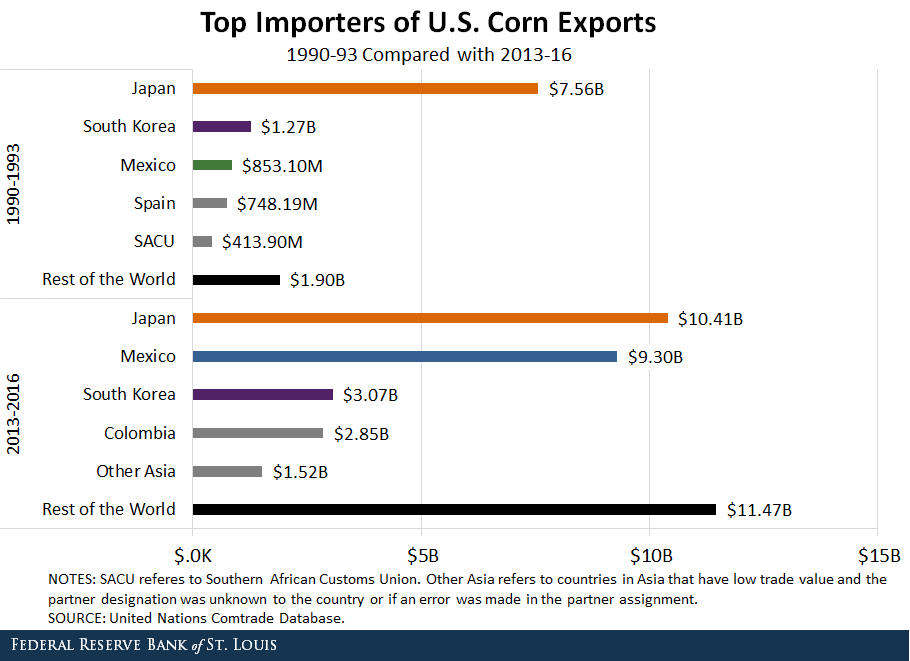
The figures below show the composition of U.S. exports of soybean, corn and wheat, according to the main destination countries (importers). We show the total value exported by the U.S. for each category during the periods 1990-93 and 2013-16.
In each figure, we single out the top five importers and aggregate the rest in a sixth category: the rest of the world.
(Click on image to enlarge)
(Click on image to enlarge)
(Click on image to enlarge)
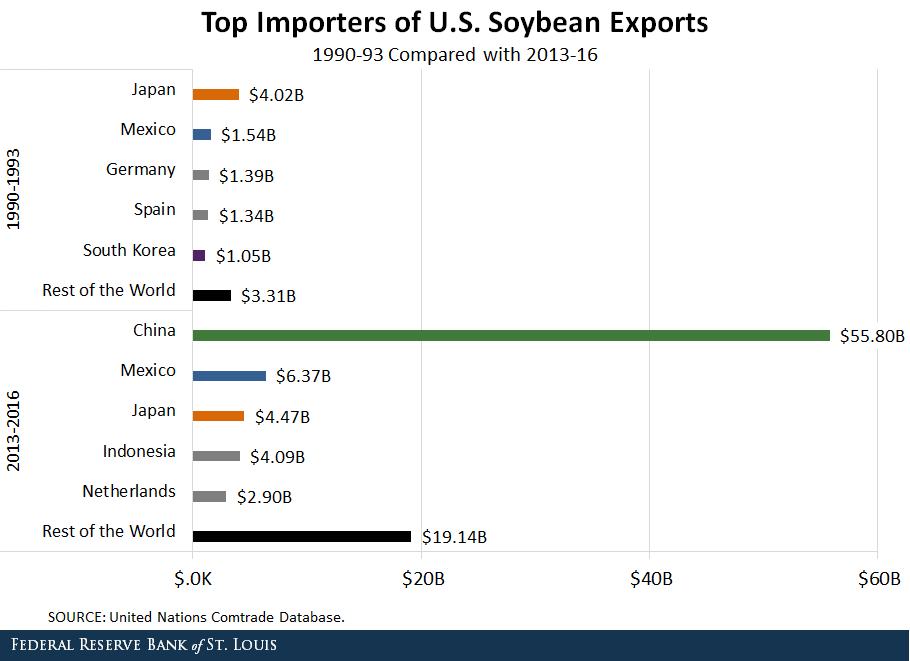
Some significant patterns are clearly discernible. For starters, notice that for all three products, the amounts exported are much higher in recent years than two decades prior. Yet, the most interesting changes are in the composition of importers. For the years 1990-93:
- Japan was the largest importer of all three products, importing 32 percent of U.S. soybean exports, 59 percent of corn exports and 33 percent of wheat exports.
- South Korea and Mexico were also significant importers, but they were dwarfed in comparison with Japan. 1
- Lastly, China was a top five importer, but only for wheat.
Dramatic Changes among Top Importers
After 25 years, the identity and relative importance of the top importers have changed, in some aspects dramatically.
Japan
First, Japan is still a major importer of all three goods, but with nowhere near the importance it had before. Japan ranks No. 1 only for corn. However, the reduction in Japan’s weight is not driven by a reduction in absolute trade, but by the expansion of U.S. exports to other countries.
China
Second, the emergence of China as a destination for American-produced soybeans is remarkable: from not even ranking among the top 5 importers during 1990-1993 to importing 60 percent of U.S. soybeans during 2013-16, with a staggering value of $55.8 billion.
Mexico
Third, Mexico is now the second main importer of American corn. The value of its import of corn has increased more than 10 times, from $853 million during 1990-93 to $9.3 billion during 2013-16, almost catching up to the value of Japan’s import of corn. Mexico has also increased the import of wheat by an order of magnitude, from $300 million to $3.1 billion.
Disclosure: None.


