
The Dumb Money And Smart Money Love The Financials
The TINA Trade Examined
As I mentioned in a previous article, some investors believe low real interest rates mean equity multiples should be high because that’s what happened in this cycle. However, usually the real rates being in the 2% to 5% range is the best because it implies economic growth is strong. Bond investors keying on the low rates in this cycle were misled as stocks increased steadily. The 10 year inflation indexed security, which we can use as a proxy for real rates, was in between 0% and 1% for most of this cycle. Real rates fell to the negatives from 2011-2013, but stocks still did well. Currently real rates are at 0.57%. To be clear high returns are not the same as high multiples. That wouldn’t be the case during a recession where earnings fell a greater percentage than stocks.
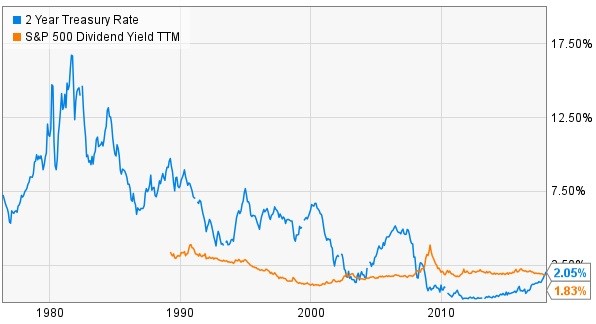
Looking at the nominal treasury yield is different obviously because it doesn’t subtract inflation. The TINA investment thesis implied stocks would do well because investors couldn’t get a good return holding treasuries to maturity. You can trade bonds for a profit, but if you hold them in the long run you’re getting the yield you bought them at. As you can see from the chart below, the 2 year bond yield has recently passed the S&P 500 dividend yield. It’s difficult to determine why some investors look at the 2 year versus the 10 year.
Either way the TINA investment thesis took a hit. The 2 year yield has been above the S&P 500 dividend yield for most of history, yet stocks have done well. You can make the argument that this new situation is what caused stocks to do well when there were low real yields. This concept will be put into question this year as the S&P 500 yield is below the 2 year yield. One idea I’m confident in is that stocks having a low dividend yield isn’t a good signal. More than a third of long term returns come from dividends. Also, a low yield implies stocks are expensive. It’s not a perfect metric because the payout ratio can be adjusted, but it gives a rough idea how stocks are valued.
(Click on image to enlarge)
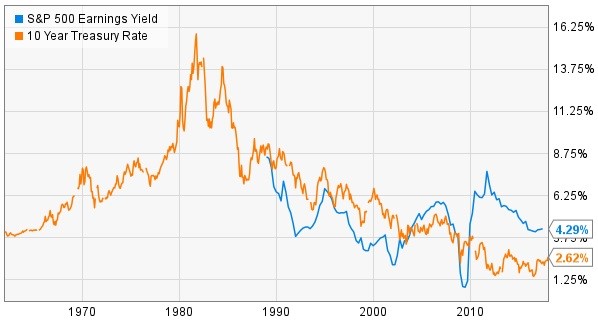
To finish off this discussion, we have the S&P 500 earnings yield in comparison to the 10 year treasury yield. The chart shows a similar result as the S&P 500’s earnings yield has been consistently above the 10 year yield this cycle. The one difference is there hasn’t been a cross over yet. The earnings yield doesn’t appear to have a relationship with the treasury yield as the yield has been in a downtrend for decades while the earnings yield has been cyclical. In this analysis we’re trying to determine if the TINA trade exists. I can’t argue that low rates aren’t causing some investors to take more risk in stocks, but I don’t think the ‘death cross’ where the treasury yield goes above the S&P 500 dividend yield is going to mean stocks will fall. It’s possible the cycle will end in a couple years, but it won’t be catalyzed by this cross over.
(Click on image to enlarge)
Fund Managers Are Underweight U.S. Stocks!
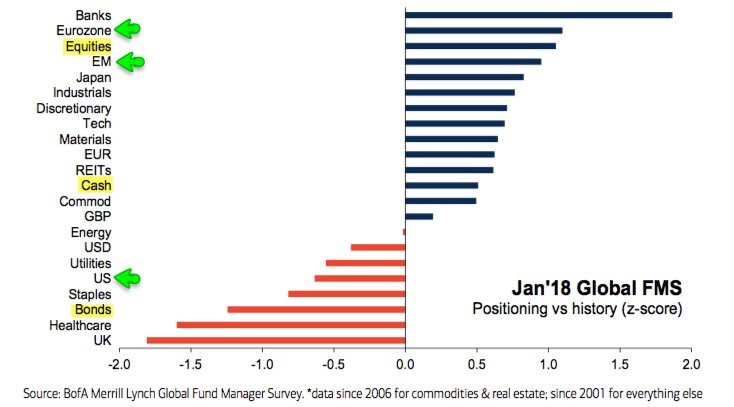
The fund managers’ survey is always interesting because it’s not directly correlated with asset prices. For example, the retail investors’ survey usually tracks the stock market. The retail investors are optimistically buying stocks because they are up. It’s doubtful many have heard of the CAPE ratio or care to learn what it is. Fund managers do more rigorous analysis and like to fade trends when they get too extended. With that understanding, let’s look at the chart below which shows the fund managers’ positioning in January. As you can see, the U.S. equities have a z-score of about -0.75. I don’t think the z-score is remarkable enough to think the trade is overextended, but it’s weird to see anyone underweight U.S. stocks with their epic performance this year. If mangers are behind for the year, they may need to play catchup because they might be underperforming.
One trade retail investors and fund mangers agree on is buying financials. The financials had $1.6 billion in inflows last week which was the most for any sector. As you can see from the chart below, the banks have a z-score of about 2 which means the trade is overextended. On the one hand, you don’t want to follow the momentum off a cliff when everyone is bullish on banks. On the other hand, the fundamentals of the sector are strong as the economy has momentum and the Fed is raising rates. The counterpoint to that caveat is that any asset which has a high z-score and is getting a lot of investment capital has great fundamentals. However, if there’s no one left to buy, the bull run might be over. I’m not saying the banks won’t have a good 2018, but there could be a correction coming.
(Click on image to enlarge)
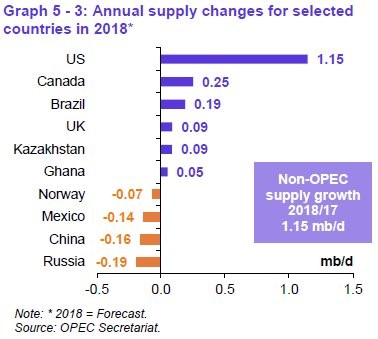
One asset which isn’t listed in the chart above, but probably has a high z-score is oil. It is at $63.57. This was the first weekly decline in 5 weeks, but it was barely down. The peak of this rally was Friday where its high was $64.50. It fell moderately this week because of worries about increasing U.S. supply. The chart below shows the expected change in non-OPEC production in 2018. As you can see, America’s production growth is responsible for all the growth. America is the largest exporter of oil in the world. It will hit record production in 2019 if the oil prices stay where they are.
(Click on image to enlarge)
Conclusion
It’s possible that the TINA trade will continue even if nominal treasury yields move up because they are still low, but it’s difficult to see it existing in the first place in the charts I reviewed. Either way, I don’t see the 2 year treasury yield rising above the S&P 500 dividend yield as a viable explanation for why stocks will underperform from when the cross over occurred.


