
Technically Speaking: Early Warning Signs In COT Positioning
This past weekend, I discussed the surge in market exuberance in terms of both individual and professional investors. Of course, such surges in exuberance is generally indicative of the “capitulation phase” as the last of the “holdouts” finally jump back into a market which “can seemingly never go down.”
But therein lies the danger. It worth noting that despite the “hope” of more fiscal support for the markets, longer-term conditions currently persist which have led to rather sharp market reversions in the past.
“There are many factors from economic, monetary, geopolitical, and financial which have ignited each bubble, and bust, period throughout history. However, each bubble had in common the same extreme levels of confidence, exuberance, valuation and price extension that we see today. And they all ended the same, as well.”
(Click on image to enlarge)
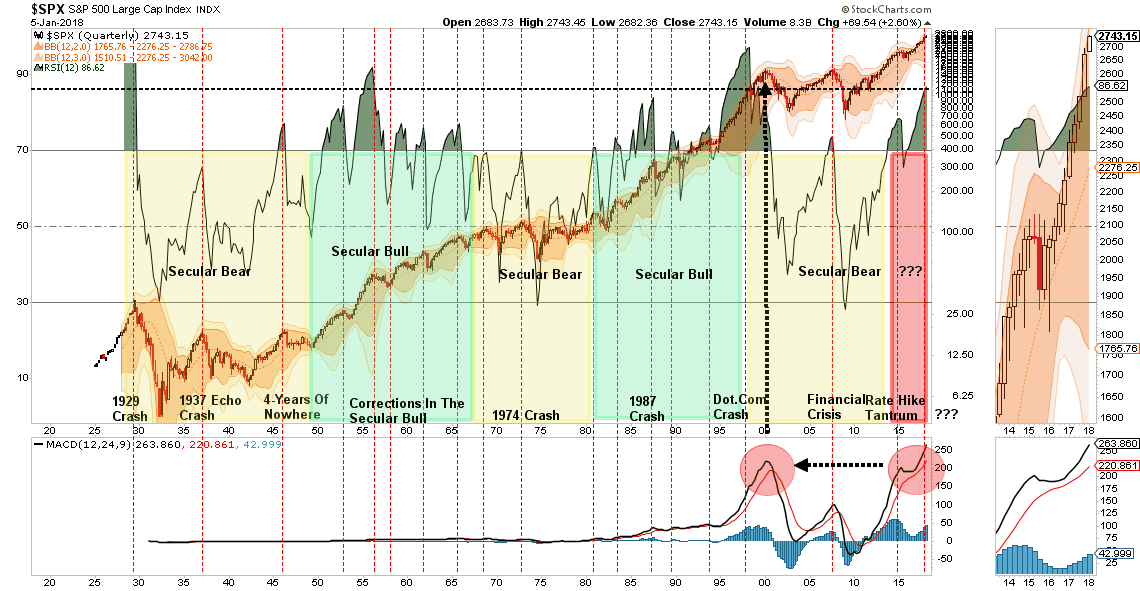
Regardless, the market is currently ignoring such realities as the belief “this time is different” has become overwhelming pervasive. Importantly, such levels of exuberance have NEVER been resolved by a market that moved sideways.
Positioning Review
The COT (Commitment Of Traders) data, which is exceptionally important, is the sole source of the actual holdings of the three key commodity-trading groups, namely:
- Commercial Traders: this group consists of traders that use futures contracts for hedging purposes and whose positions exceed the reporting levels of the CFTC. These traders are usually involved with the production and/or processing of the underlying commodity.
- Non-Commercial Traders: this group consists of traders that don’t use futures contracts for hedging and whose positions exceed the CFTC reporting levels. They are typically large traders such as clearinghouses, futures commission merchants, foreign brokers, etc.
- Small Traders: the positions of these traders do not exceed the CFTC reporting levels, and as the name implies, these are usually small traders.
The data we are interested in is the second group of Non-Commercial Traders.
This is the group that speculates on where they believe the market is headed. While you would expect these individuals to be “smarter” than retail investors, we find they are just as subject to human fallacy and “herd mentality” as everyone else.
Therefore, as shown in the series of charts below, we can take a look at their current net positioning (long contracts minus short contracts) to gauge excessive bullishness or bearishness. With the exception of the 10-Year Treasury which I have compared to interest rates, the others have been compared to the S&P 500.
Volatility Extreme
The extreme net-short positioning on the volatility index suggests there will be a rapid unwinding of positions given the right catalyst. As you will note, reversals of net-short VIX positioning has previously resulted in short to intermediate-term declines.
Currently, the record level of short-volatility positions has started to decline. Such events have tended to precede market corrections in the past as seen in early 2016 as the then-record net-short positioning turned net-long.
(Click on image to enlarge)
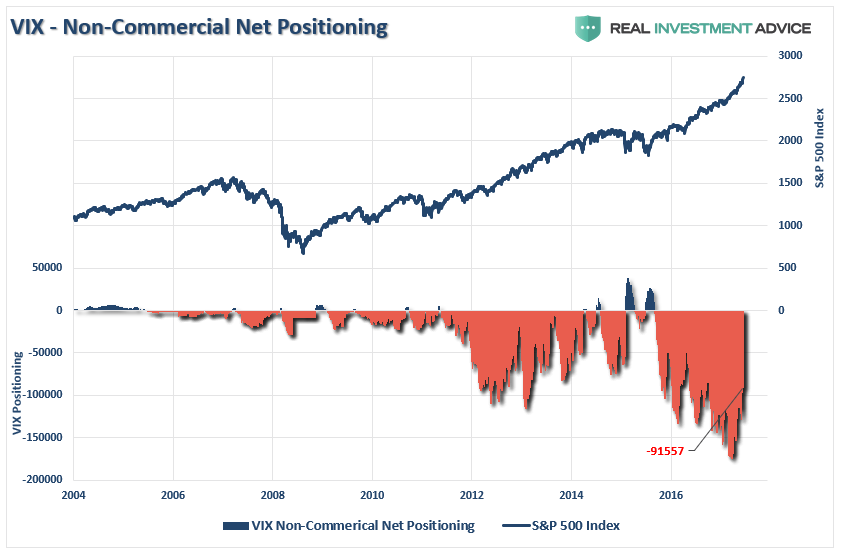
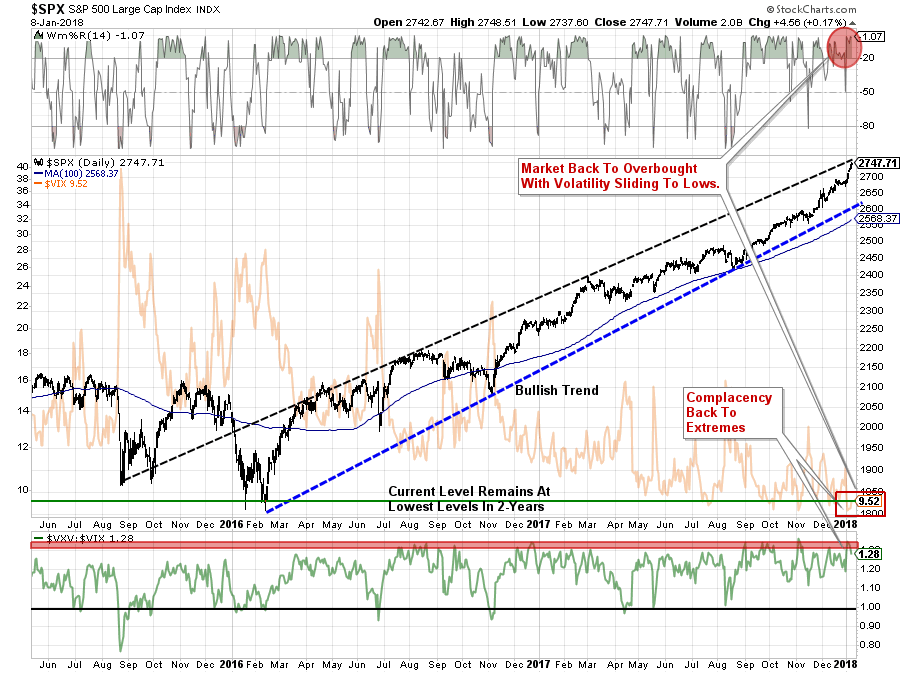
With the ratio of the short-to-long term VIX index at near record levels, with the market also pushing the upper-end of the current trading range, the reduction in the net-short positioning suggest a correction in the next couple of months is likely. Currently, such a correction should remain confined within the bullish trend channel. However, a violation of that channel will certainly get our attention.
(Click on image to enlarge)
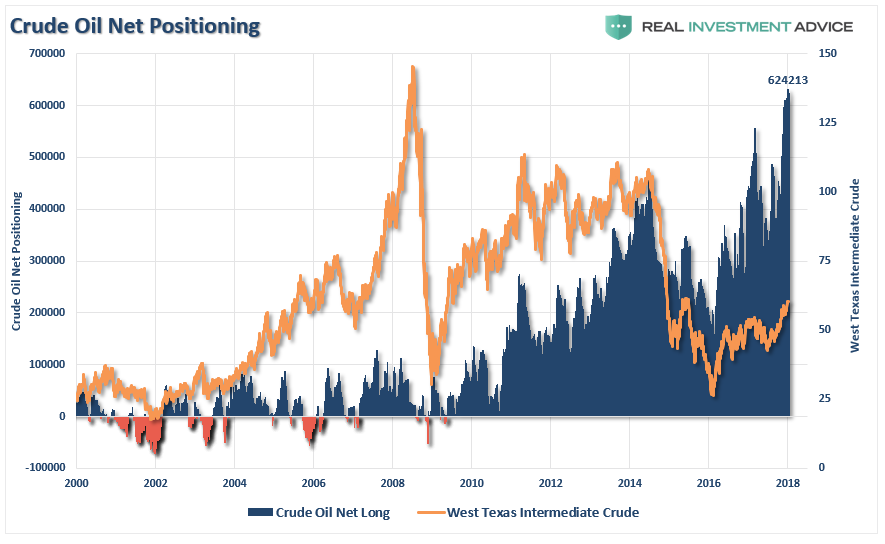
Crude Oil Extreme
The recent attempt by crude oil to get back to $60/bbl coincided with a “mad rush” by traders to be long the commodity. For investors, it is also worth noting that crude oil positioning is also highly correlated to overall movements of the S&P 500 index. With crude traders currently extremely “long,” a reversal will likely coincide with both a reversal in the S&P 500 and oil prices being pushed back towards $40/bbl.
(Click on image to enlarge)

While oil prices could certainly fall below $40/bbl for a variety of reasons, the recent bottoming of oil prices around$45/bbl should provide some reasonable support (barring an economic recession.)
(Click on image to enlarge)
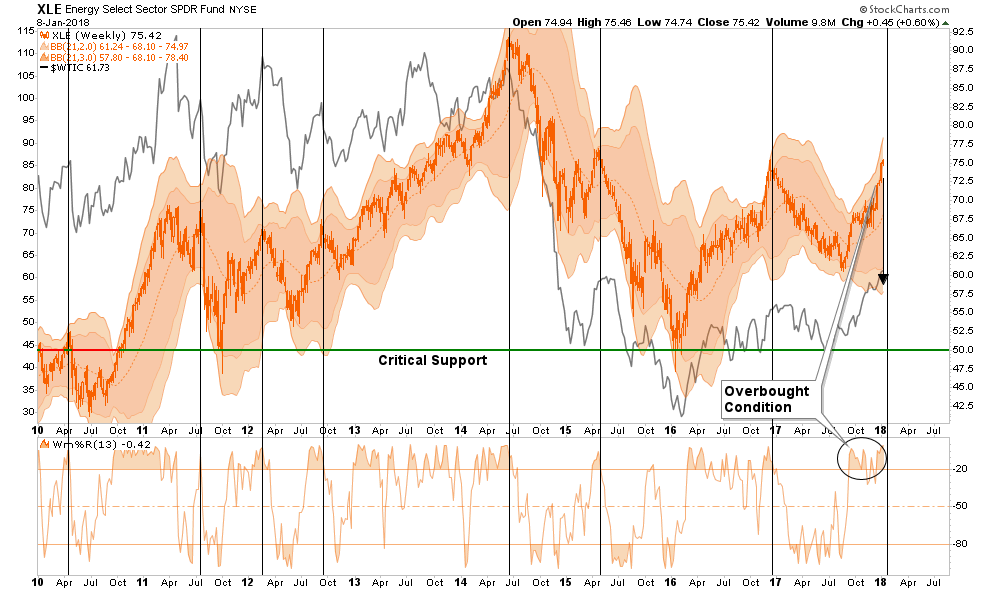
Given the extreme long positioning on oil, a reversion of that trade will likely coincide with a “risk off” move in the energy sector specifically. As you know, we added a trading position in XLE back in December, we will continue to maintain that position for now, but with the sector now very overbought and extended we will look to rebalance our positions in portfolios.
(Click on image to enlarge)
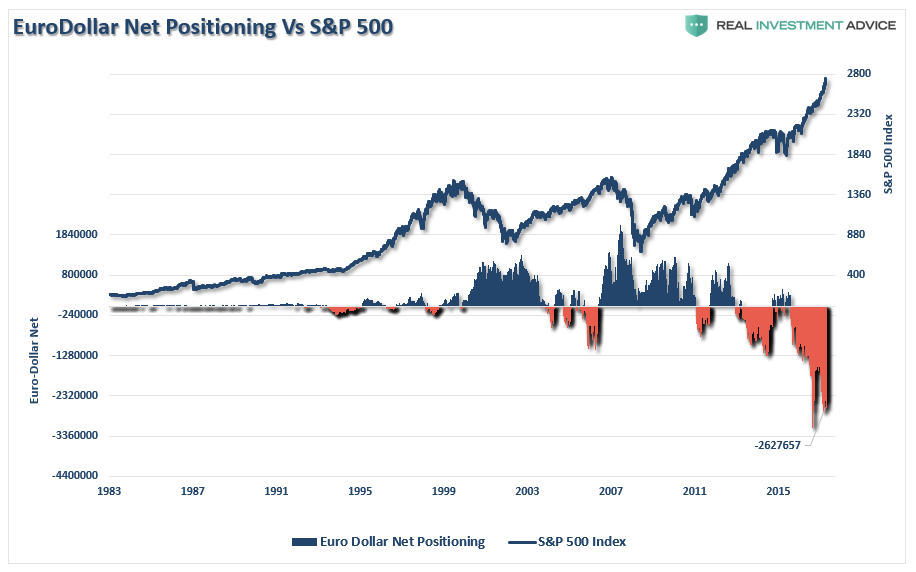
US Dollar Extreme
Recent weakness in the dollar has been used as a rallying call for the bulls. However, a reversal of US Dollar positioning has been extremely sharp and has led to a net-short position.
(Click on image to enlarge)
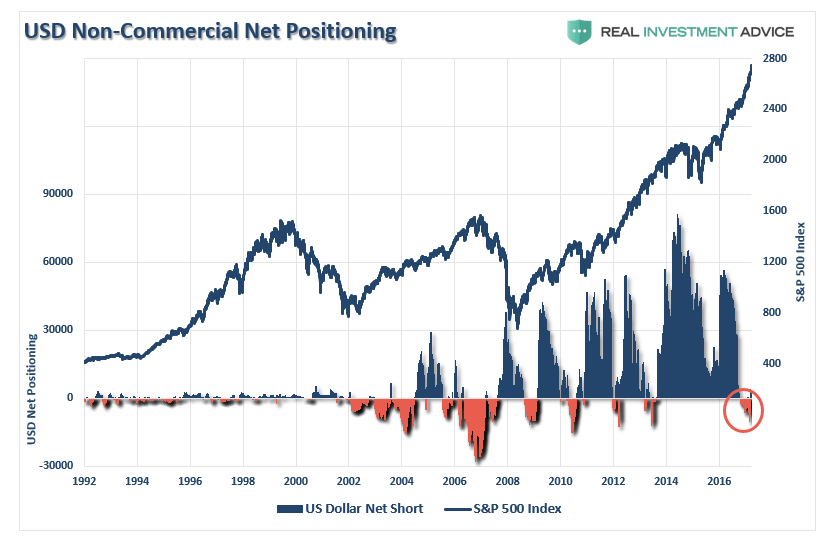
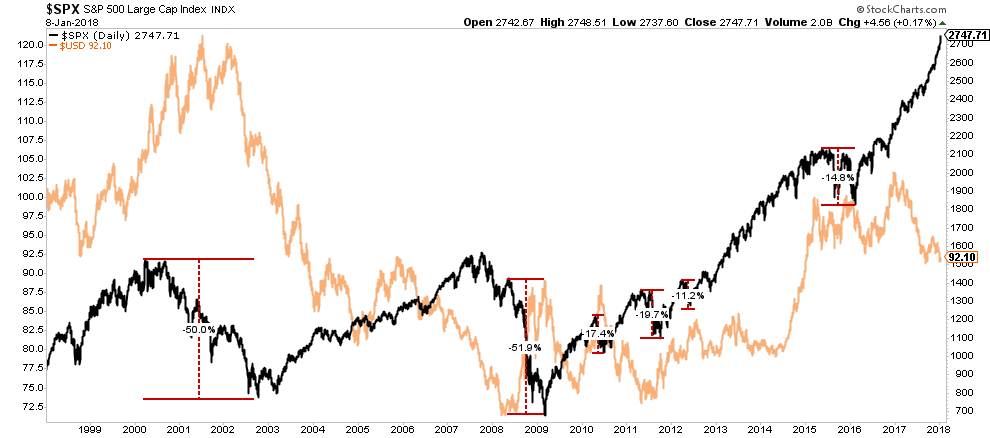
As shown above, and below, such negative net-short positions have generally marked both a short to intermediate-term low for the dollar as well as struggles for the S&P 500 as a stronger dollar begins to weigh on exports and earnings estimates. Just recently, that net-short positioning has turned positive which suggest a rally in the dollar is likely.
(Click on image to enlarge)

Historically, strong dollar rallies have not been kind to asset prices. With tax cuts now passed, and near-term bump to economic strength will lead to an influx into dollar-denominated assets. Strong dollar surges negatively impact exports which comprises roughly 40% of corporate earnings. With the dollar VERY oversold currently, look for a strong-dollar rally this year.
(Click on image to enlarge)
It is also worth watching the net-short positioning the Euro-dollar as well which has also begun to reverse in recent weeks. Historically, the reversal of the net-short to net-long positioning on the Eurodollar has often been reflected in struggling financial markets. The reversal is still early, but worth watching closely.
(Click on image to enlarge)
Interest Rate Extreme
One of the biggest conundrums for the financial market “experts” is why interest rates fail to rise. Apparently, traders in the bond market failed to get the “memo.” The reversal of the net-long positioning in Treasury bonds will likely push bond yields lower over the next few months. This will accelerate if there is a “risk-off” rotation in the financial markets in the weeks ahead.
(Click on image to enlarge)
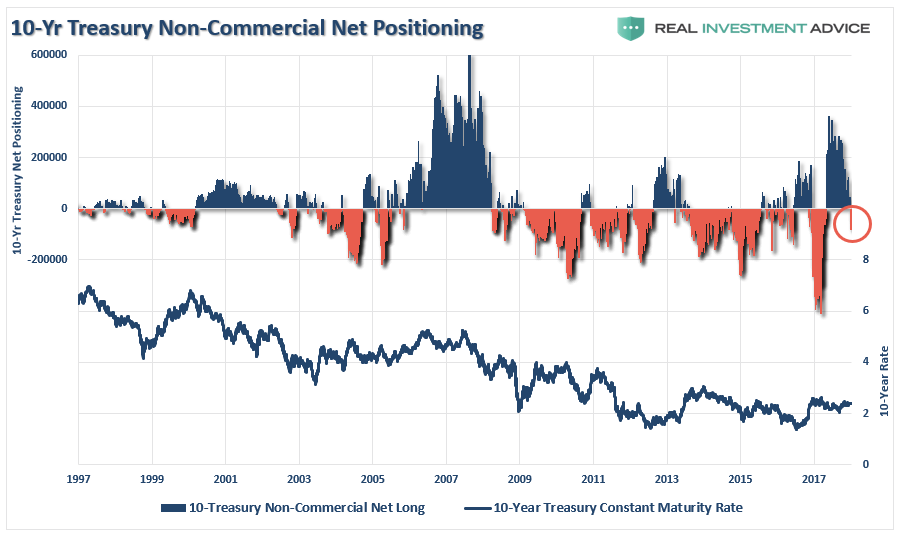
More importantly, yields are now approaching levels which have historically been significant buying opportunities to add exposure to portfolios particularly if yields begin to approach 3% as last seen in 2014.
(Click on image to enlarge)

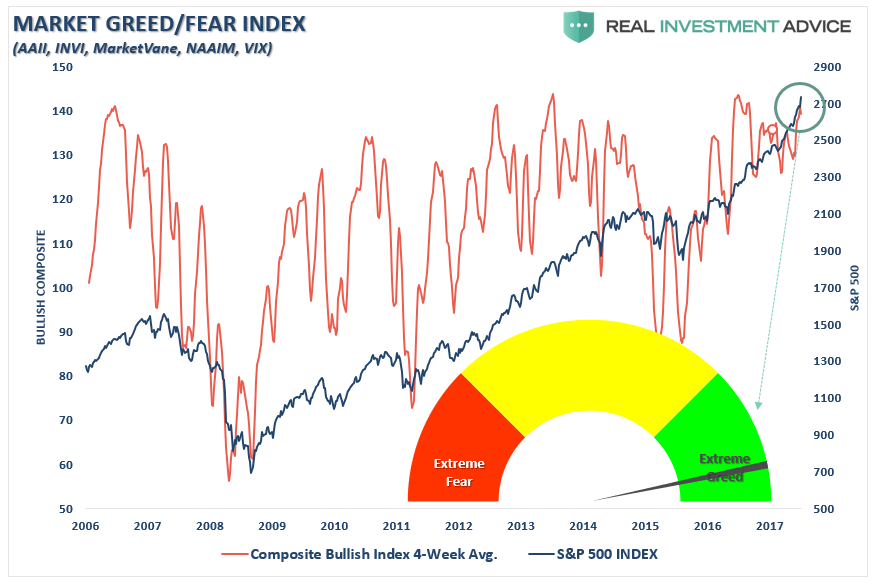
Smart Vs. Dumb Money Extreme
As I noted this past weekend, investors are currently “all in” on a variety of “sentiment” based measures.
“Even our composite fear/greed index which is a combination of AAII, INVI, MarketVane and the VIX is now also registering extreme greed on a rolling 4-week basis.”
(Click on image to enlarge)
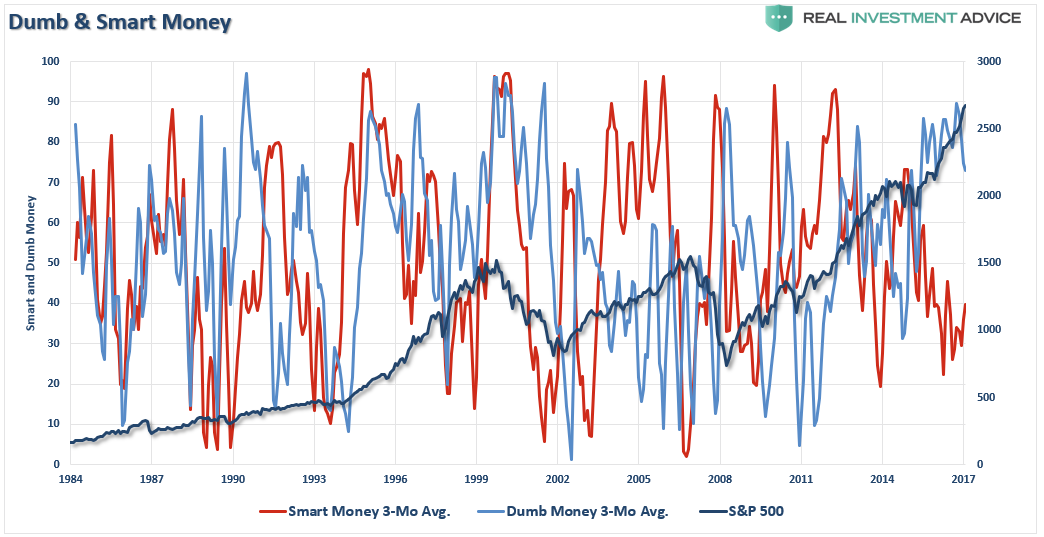
However, we can also look at the overall net exposure of retail investors (considered the “dumb money”) versus that of the major institutional players (“smart money”)
The first chart below shows the 3-month moving average of both smart and dumb-money players as compared to the S&P 500 index. With dumb-money running close to the highest levels on record, it has generally led to outcomes that have not been favorable in the short-term.
(Click on image to enlarge)
We can simplify the index above by taking the net-difference between the two measures. Not surprisingly, the message remains the same. With the confidence of retail investors running near historic peaks, outcomes have been less favorable.
(Click on image to enlarge)

Amazingly, investors seem to be residing in a world without any perceived risks and a strong belief that the financial markets are NOT in a bubble. The arguments supporting those beliefs are based on comparisons to previous peak market cycles.
The inherent problem with much of the mainstream analysis is that it assumes everything remains status quo. But data, markets, economies, and liquidity are never the same. The question is simply what can go wrong for the market?
In a word, “much.”
It is likely that in a world where there is “no fear” of a market correction, an overwhelming sense of “urgency” to be invested, and a continual drone of “bullish chatter;” markets are poised for the unexpected, unanticipated and inevitable reversion.
But that doesn’t mean today, tomorrow or next week? No.
With the markets up more than 2% during the “first 5-trading days of January,” the bulls remain clearly in charge of this market. Historically, when the first 5-days have been positive, so has the year. More importantly, when the first 5-days have been up 2% or more as is currently the case, the market has posted double-digit gains for the year.
We remain fully allocated to markets currently, although we have added some “risk hedges” to portfolios recently.
With investor exuberance pushing peaks, it is not surprising to see net positioning extremely one-sided. Just understand, that positioning will NOT always be that way. When this current cycle ends, and it will, it will just as disastrous to long-term investment objectives as every other reversion throughout history.
Pay attention, have a plan and act accordingly.
Disclosure: The information contained in this article should not be construed as financial or investment advice on any subject matter. Streettalk Advisors, LLC expressly disclaims all liability in ...
more

