
Technically Speaking: Bulls Struggle With Bearish Internals

In this past weekend’s newsletter, I discussed the fact that despite the bullish “exuberance” of market participants, the underlying internal deterioration has continued. To wit:
“Furthermore, the underlying internals have continued to weaken over the last week which has remained a concern over the last couple of months.
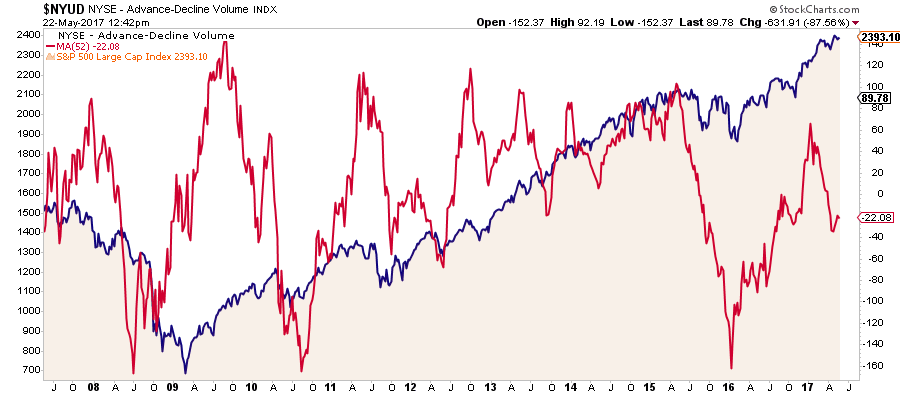
The 10-year chart below, while a bit cluttered, shows several very important things worth considering currently. First, the top part of the weekly chart is essentially a buy/sell indicator. Each sell signal previously, has been indicative of a correction. The middle of the chart is a combination of internal strength indicators from the number of stocks on bullish buy signals, advancing vs declining issues and volume, and the percent of stocks above their 200-day moving average.”
(Click on image to enlarge)
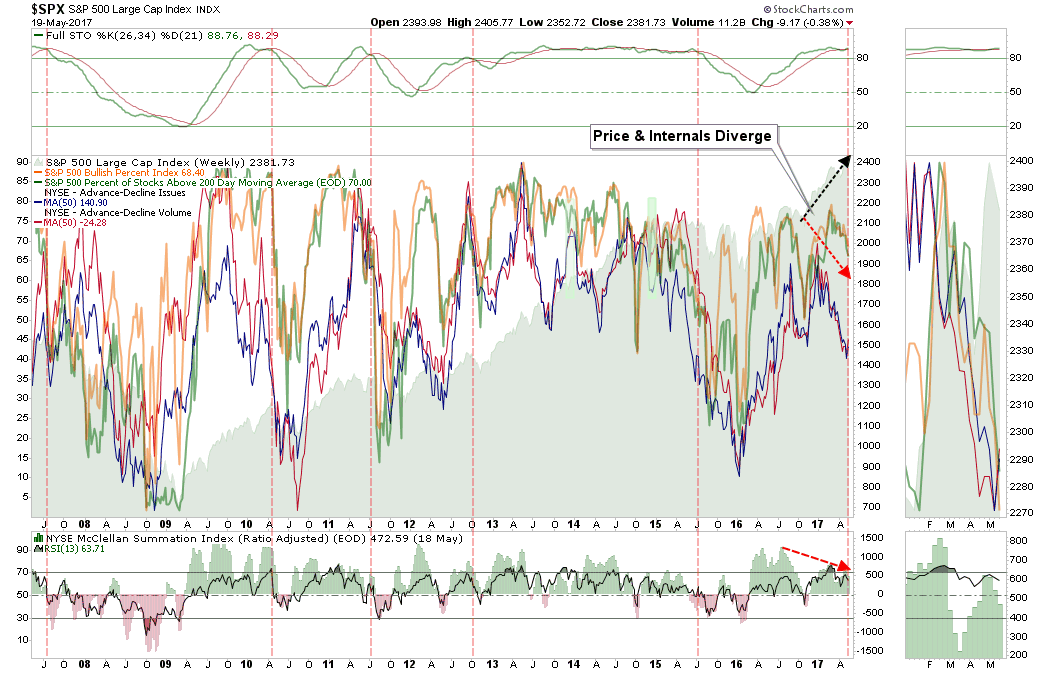
“With all the internal indicators currently on the decline, when combined with a stochastic ‘sell signal,’ there is a higher probability of a correction in the weeks ahead. While this time could certainly be different, it is probably worth noting that making such a bet with your retirement money has not often ended well.”
As I stated, the chart above is a bit cluttered so I wanted to use today’s technical update to take a closer look at the internals supporting the current bull run.
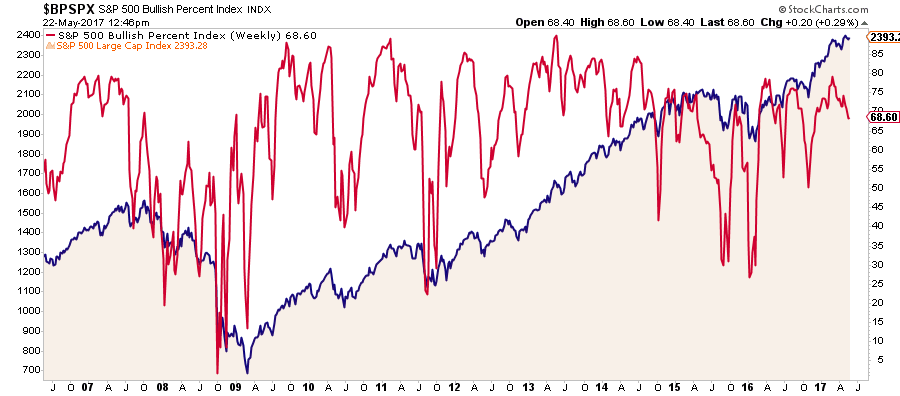
Number Of Stocks On Bullish Buy Signals
The number of stocks on bullish “buy” signals continues to wane despite the markets pushing all-time highs. This continues to suggest the underlying participation remains weak as the “breadth” of the advance has narrowed.
(Click on image to enlarge)
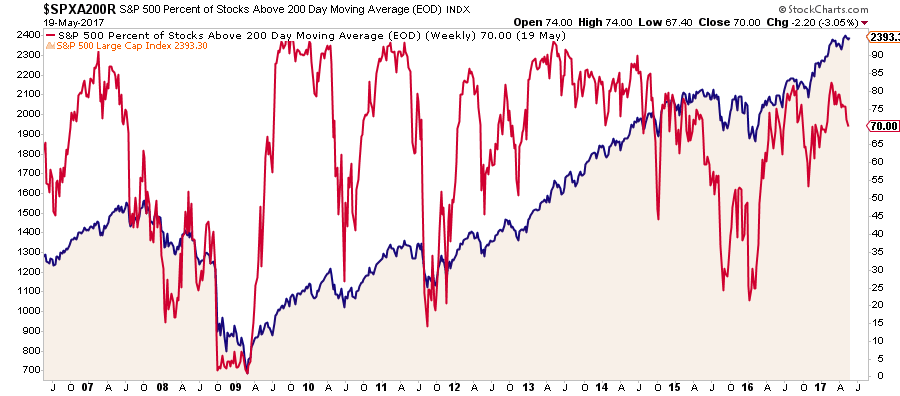
Number Of Stocks Above Their 200-Day Moving Average
The same can be seen in the number of stocks trading above their 200-day moving average. Deterioration in advance of a decline has historically been a good warning sign to scale back portfolio risk.
(Click on image to enlarge)
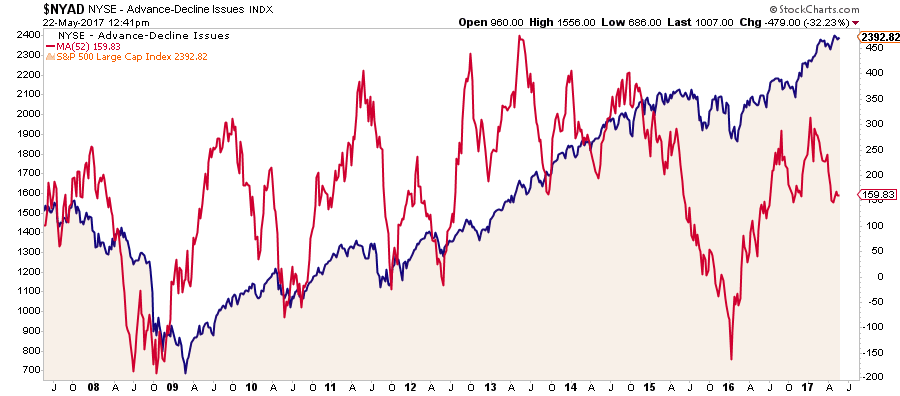
Number Of Advancing Issues (50-Day Moving Average)
The number of issues advancing on the NYSE has likewise deteriorated and has now diverged from the advance in the market. Participation is coincident with a rising “bull market, “ and deterioration of participation has also been a warning sign of forthcoming weakness.
(Click on image to enlarge)
Volume Of Advancing Issues (50-Day Moving Average)
The same is true for the volume of advancing issues on the NYSE.
(Click on image to enlarge)
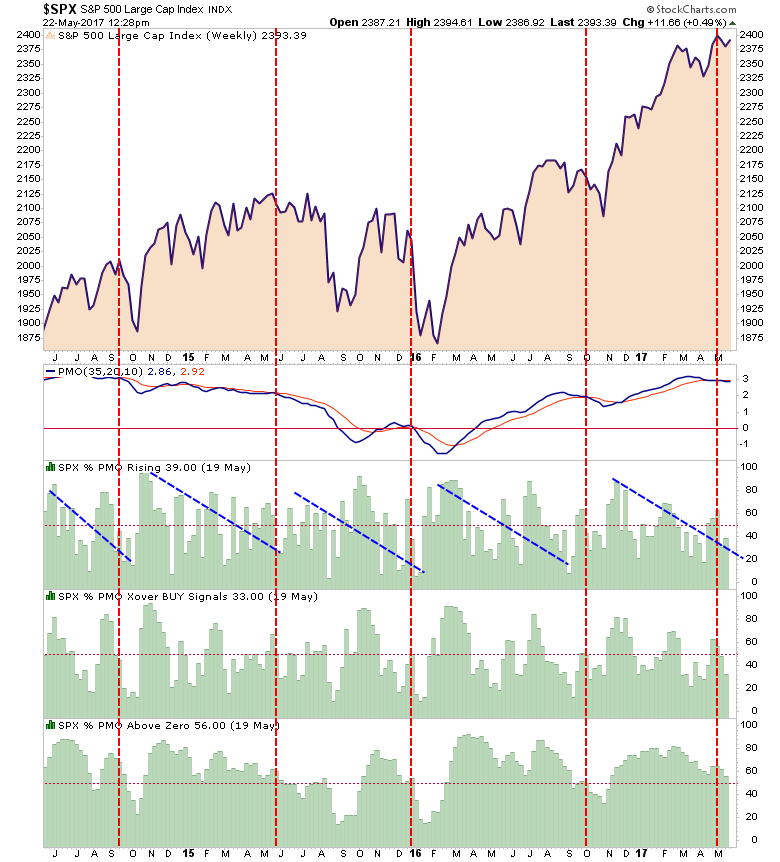
Price Momentum
Multiple measures of price momentum of the S&P 500, as shown below, also suggests a market that is currently extremely advanced and vulnerable to a corrective action. The dashed red lines denote when the price momentum oscillator has triggered a “sell” signal previously.
(Click on image to enlarge)
Yields Need To “Buy It”
Lastly, despite stocks pushing near all-time highs, the bond market continues to flirt with levels close to 2%. The continued move to “risk off” holdings, despite a rising stock market, suggests that ultimately either stocks OR bonds will be wrong. Historically, bonds have tended to be right more often than not.
(Click on image to enlarge)

The Yin & Yang Of It
None of the above should be construed that I am saying a “bear market” is fast approaching. For now, market prices remain elevated on the “hope” the “mythical tax cuts/reforms” will soon appear. If they do, great, as asset prices should get a temporary lift higher. The risk is the “swamp devours Trump,” and Washington gridlock keeps progress frozen until the 2018 election cycle. The question is how long will “hope” hold out over legislative advancement?
However, there is a bigger issue on the horizon for the bulls and it can be summed up as follows:
“The longer a bull market exists, the more it is believed that it will last indefinitely.”
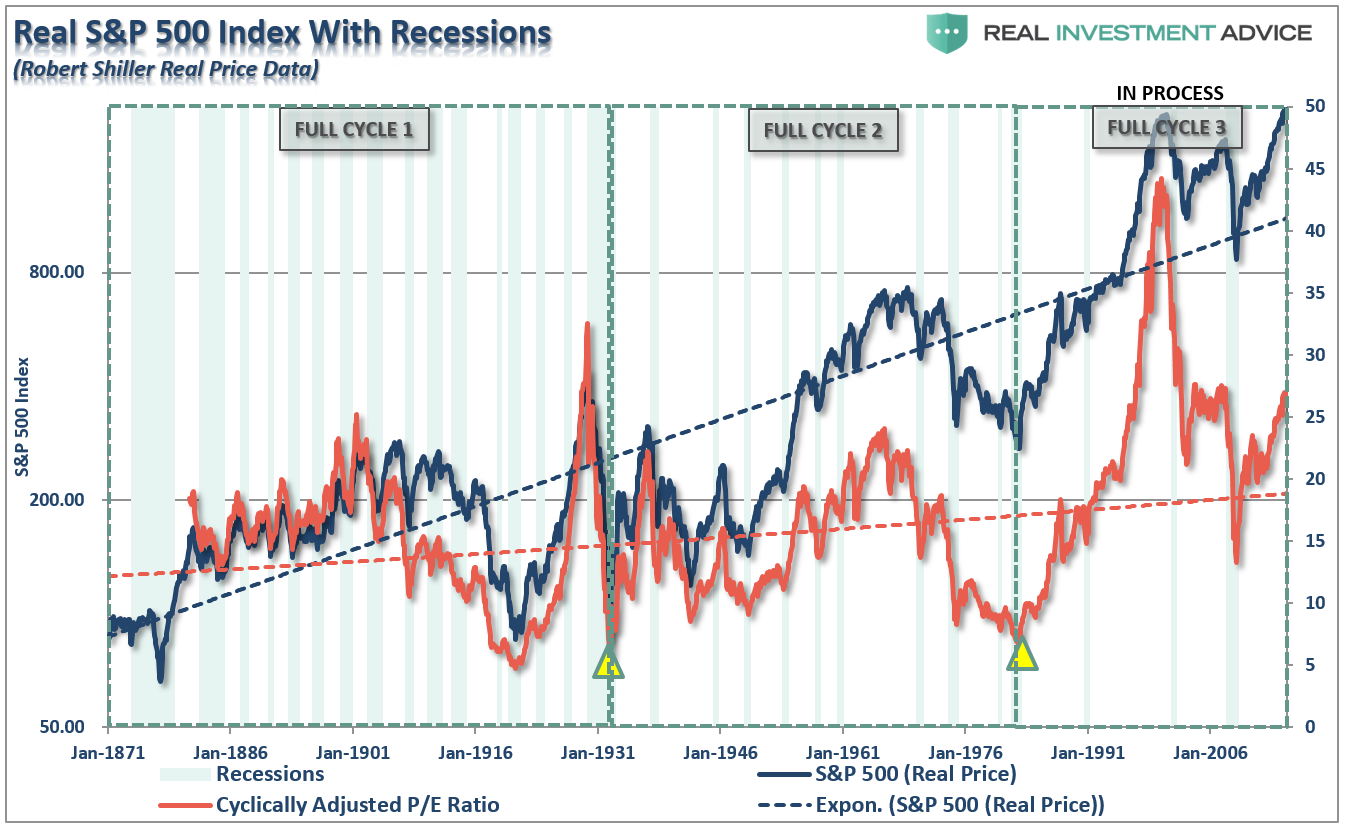
Unfortunately, as it is with all things in life, to each there is a cycle. The chart below shows the long-term view of the market with its inherent full-market (combined bull and bear) cycles exposed.
(Click on image to enlarge)
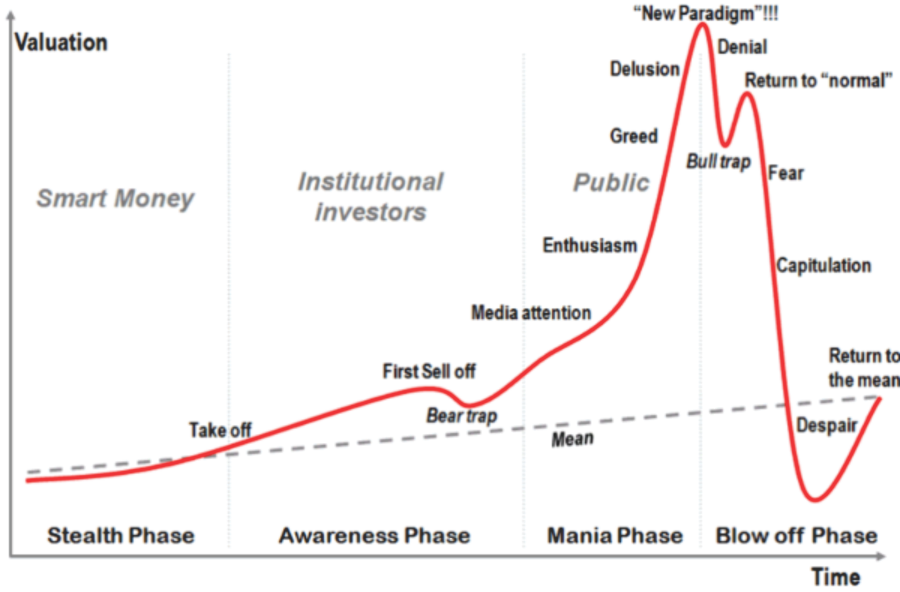
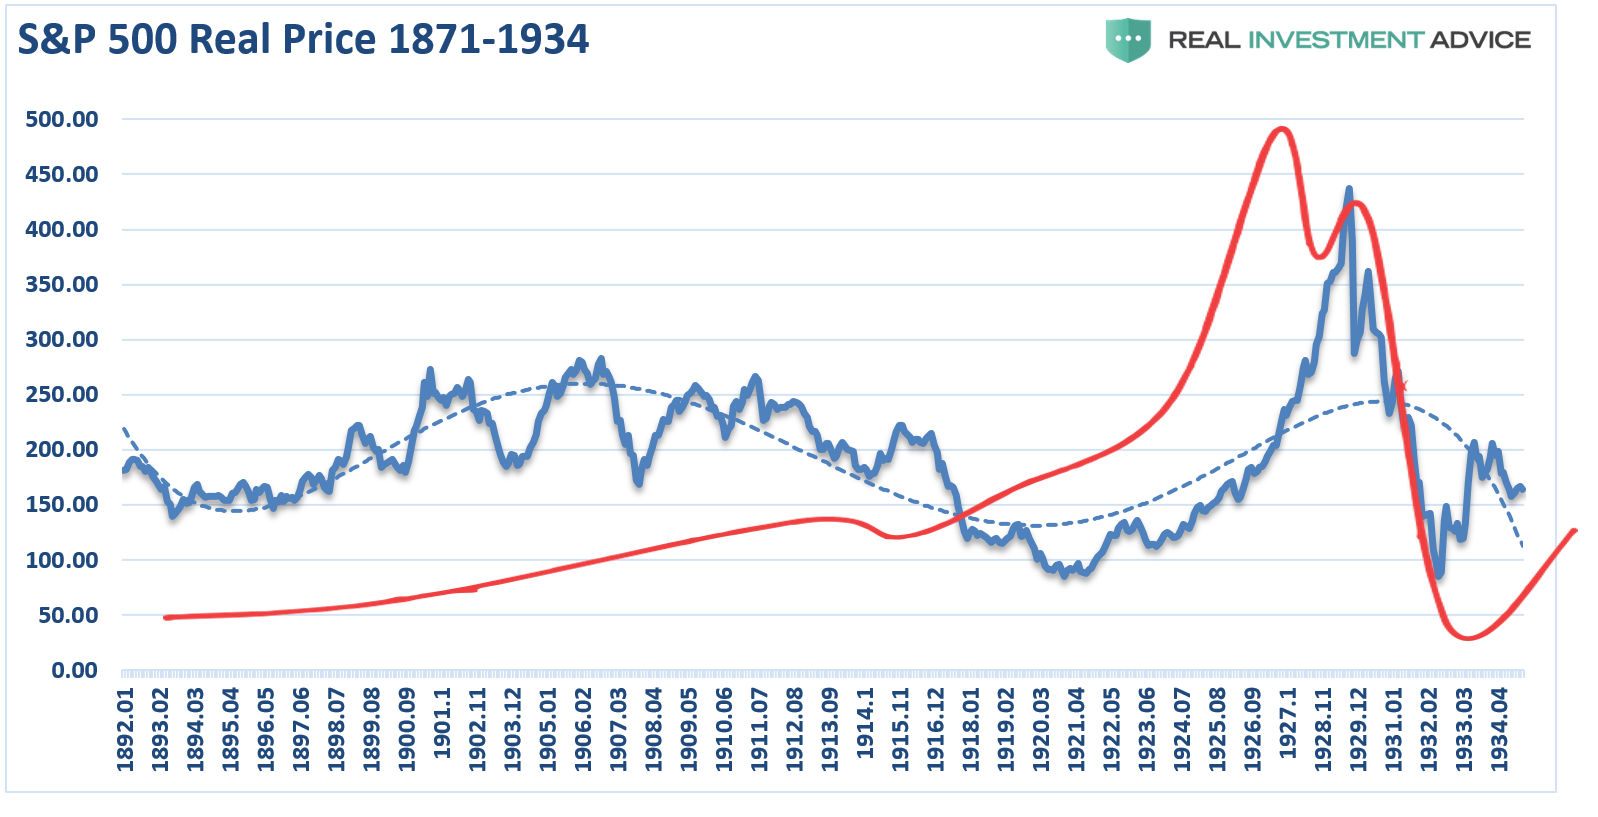
The idea of full market cycles is important to understand. “Where” you are within the current long-term investing cycle has everything to do with your long-term outcomes. The charts below take the classic investing psychology cycle (below) and overlays it with the long-term full market cycles driven by valuation cycles in the chart above.
(Click on image to enlarge)
The first full-market cycle lasted 63-years from 1871 through 1934. This period ended with the crash of 1929 and the beginning of the “Great Depression.” If you invested in the financial markets at any point prior to 1920, you likely died much worse off than when you started.
(Click on image to enlarge)
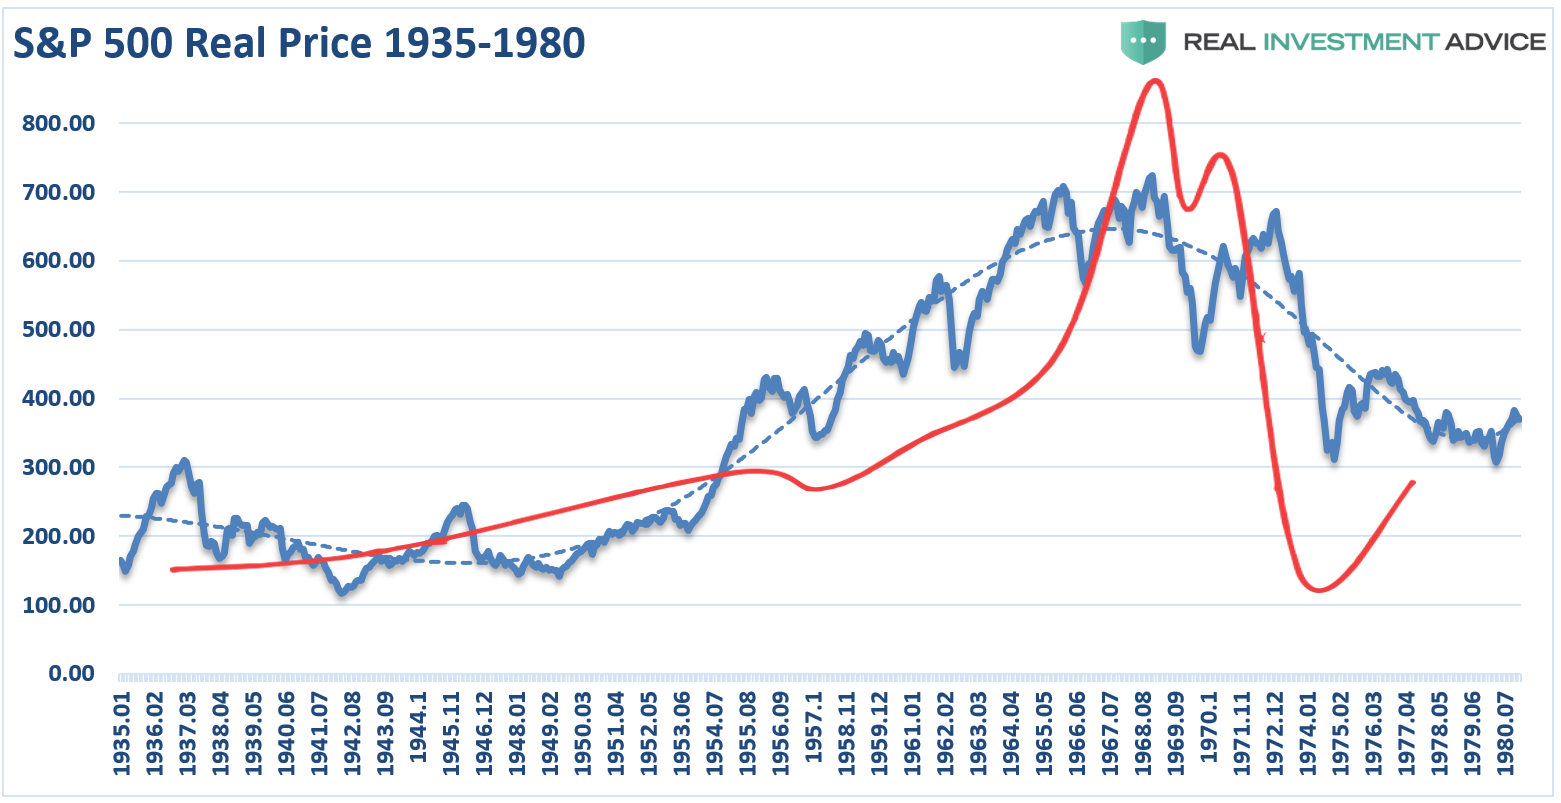
The second full-market cycle lasted 45-years from 1935-1980. This cycle ended with the demise of the “Nifty-Fifty” stocks and the “Black Bear Market” of 1974. While not as economically devastating to the overall economy as the 1929-crash, it did greatly impair the investment psychology of those in the market. But even in this cycles, many individuals ran out of time long before achieving the financial goals they were promised.
(Click on image to enlarge)
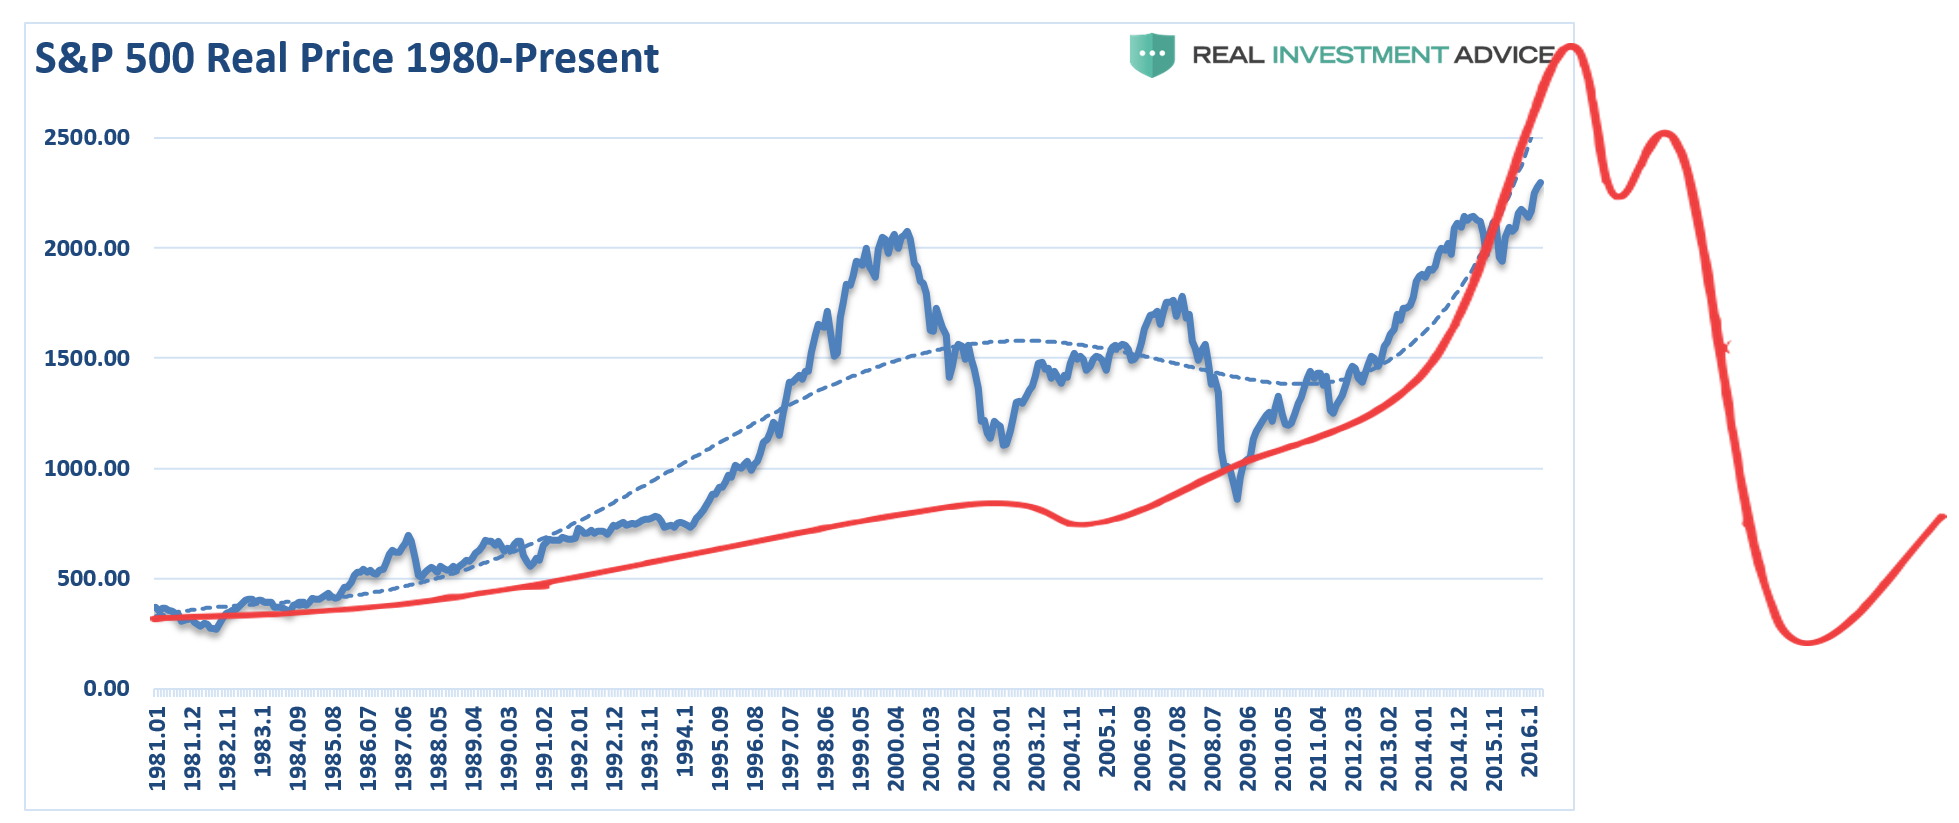
The current full-market cycle is only 37-years in the making. Given the 2nd highest valuation levels in history, corporate, consumer and margin debt near historical highs, and average economic growth rates running at historical lows, it is worth questioning whether the current full-market cycle has been completed or not.
Importantly, considering most individuals didn’t start investing until near the turn of the century, much of the damage from the last two bear markets still remain. If the next down cycle completes the pattern, it is quite likely most investors won’t live long enough to be repaired by the first-half of the next cycle.
(Click on image to enlarge)
The idea the “bull market” which begin in 1980 is still intact is not a new one. As shown below a chart of the market from 1980 to present, suggests the same.
(Click on image to enlarge)
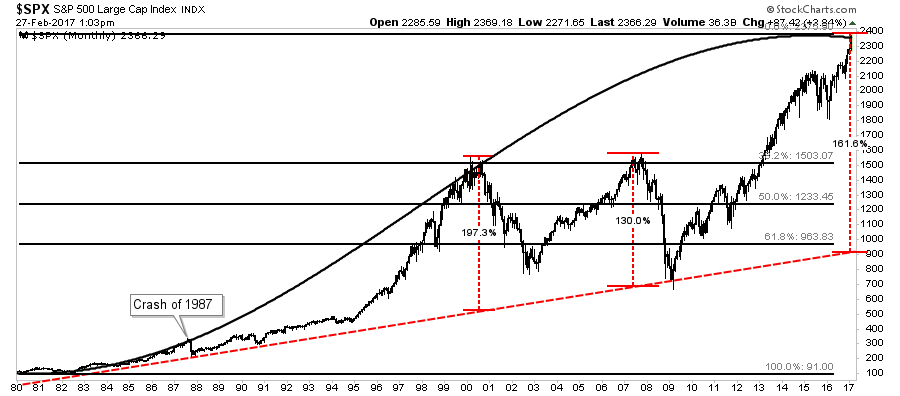
The long-term bullish trend line remains and the cycle oscillator is only half-way through a long-term cycle. Furthermore, on a Fibonacci-retracement basis, a 61.8% retracement would current intersect with the long-term bullish trendline around 1000 suggesting the next downturn could indeed be a nasty one. But again, this is only based on the assumption the long-term full market cycle has not been completed as of yet.
I am NOT suggesting this is the case. This is just a thought-experiment about the potential outcome from the collision of weak economics, high levels of debt, and valuations and “irrational exuberance.”
Yes, this time could entirely be different.
It just never has been before. As I noted this past weekend, Rich Breslow summed the current environment up well, and is worth repeating in case you missed it.
“Markets can trend, range trade, and correct. But one thing they can’t do under the current scenario is time-correct. The minute they stop moving, a powerful, even if short-lived, impulse takes over to reevaluate, cherry-pick and average down. Even if you’re sure the story hasn’t run its course, it takes real moxie to remain exposed to the other side of trades you were very comfortably holding for the previous weeks and months.
We’re all leery of getting caught in over-crowded trades. Nothing feels more teeming than new trades predicated on emotion. Even if you feel very strongly about the subject. This is a be nimble, very nimble, environment when we’ve been rewarded time and again for buying and holding. Traders will need skills that have atrophied over years. Another reason we are years away from ‘normal.’”
I suspect he is right.
In the short-term, the market’s internals need to improve to support the ongoing bullish thesis. Our portfolios remain long-biased currently, but we have rebalanced by harvesting some profits and raising a little higher than normal cash levels.
(Click on image to enlarge)

However, in the longer-term as shown above, fundamental underpinnings continue to suggest the risk/reward ratio is heavily tilted against investors trying to “passively” index their portfolios. Such “armchair” approaches to investing are generally only seen in late stage bull market advances as “exuberance exceeds grasp.” The reason is it takes a very long period of a bullish advance to wipe-out the painful memories of the losses incurred by those same approaches previously.
The reminder will be just as painful.
Disclosure: The information contained in this article should not be construed as financial or investment advice on any subject matter. Streettalk Advisors, LLC expressly disclaims all liability in ...
more

