
T2108 Update – A Fed Hangover Bursts The Overbought Rally
(T2108 measures the percentage of stocks trading above their respective 40-day moving averages [DMAs]. It helps to identify extremes in market sentiment that are likely to reverse. To learn more about it, see my T2108 Resource Page. You can follow real-time T2108 commentary on twitter using the #T2108 hashtag. T2108-related trades and other trades are occasionally posted on twitter using the #120trade hashtag. T2107 measures the percentage of stocks trading above their respective 200DMAs)
T2108 Status: 66.9% (ends 5-day overbought period)
T2107 Status: 63.6%
VIX Status: 13.2
General (Short-term) Trading Call: cautiously bearish
Active T2108 periods: Day #206 over 20%, Day #26 over 30%, Day #25 over 40%, Day #23 over 50%, Day #17 over 60%, Day #1 under 70% (ends 5-day overbought period)
Commentary
It was fun while it lasted.
The “extended” overbought rally turned out not to extend all that far. The chart below shows the 5-day period was just barely beyond the 1-2 day typical duration of the overbought period.
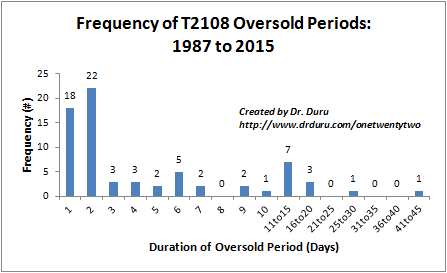
This frequency (distribution) chart for oversold duration shows that over half of oversold periods last just one or two days.
The S&P 500 (SPY) had a middling showing during this overbought period. Its 0.5% gain put its performance right in the middle of the noise for such a short duration.
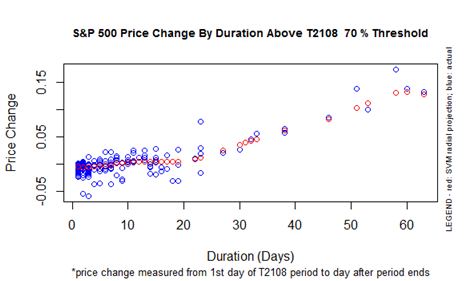
S&P 500 Performance By T2108 Duration Above the 70% Threshold
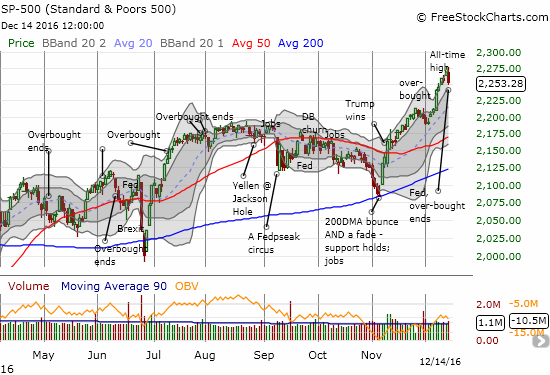
Post-Fed hangover: The S&P 500 ended the latest overbought period with a 0.8% tumble off its all-time high.
The above chart of the S&P 500 shows how the index tumbled out of overbought conditions and off its all-time high in the wake of the U.S. Federal Reserve’s latest decision on monetary policy. The Fed hiked interest rates 25 basis points – the first rate hike in a year and just the second since financial crisis. The Fed also claimed that it anticipates three rate hikes in 2017. The market apparently was thinking two. I think it will end up being two MAX (recall that last year the Fed anticipated FOUR rate hikes in 2016). Chair Janet Yellen tried to emphasize that the change in Fed expectations is very slight and nearly insignificant in the larger scheme of things. In fact, the entire prepared statement and responses to the Q&A during the press conference all followed a familiar Fed template. Yet, the effort fell on deaf ears. The market certainly acted like this announcement was very hawkish.
I found one particularly interesting example of a pundit force fitting a hawkish lens on the Fed’s statement. This pundit claimed that the Fed’s statement was “flat out hawkish”. He was not just floored by the claim on three rate hikes in 2017 but also “…more staggering was the fact the Fed did not hedge their opinion by making any direct reference to data dependency in their call.” And yet, the prepared statement contained the very familiar reassurance “The Committee expects that economic conditions will evolve in a manner that will warrant only gradual increases in the federal funds rate; the federal funds rate is likely to remain, for some time, below levels that are expected to prevail in the longer run. However, the actual path of the federal funds rate will depend on the economic outlook as informed by incoming data” (emphasis mine).
So on hawkish wings, the U.S. dollar index (DXY0) managed to rally to a fresh 13-year high…
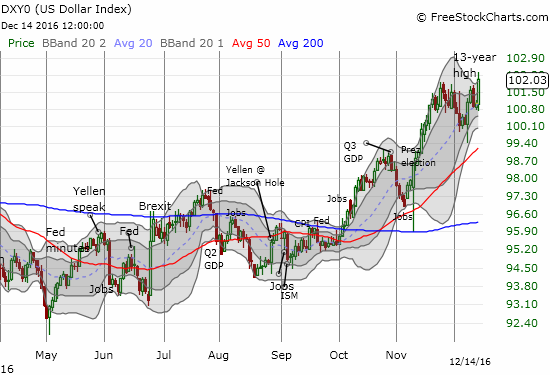
The U.S. dollar index managed to rally to a new 13-year high.
With 3 rate hikes supposedly on tap for 2017, I was surprised to see that the 30-day Fed Fund Futures are pricing in the next Fed hike all the way out in June. This distance makes sense given at that time, presumably, the Fed will have a firm idea of the fiscal stimulus plans coming from the incoming Trump administration. Yet, if the Fed waits until June, I have a hard time believing it will cram two more hikes in the next 6 months unless of course the economy is accelerating at that time.
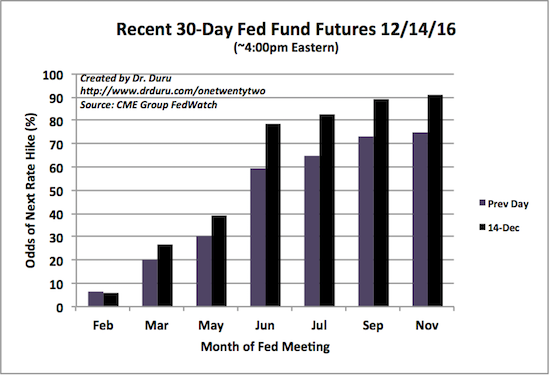
Futures markets do not expect the next Fed hike anytime soon: odds do not hurdle 50% until the June meeting.
Source: CME Group FedWatch
Anyway, the post-Fed surge in the dollar had all the expected impacts on commodity-related plays. However, Cliffs Natural Resources (CLF) stood out as it rallied at one point to a 8.9% gain on the day in the wake of news of changes in executive leadership. This surge sent my call options on CLF to a double. I followed a long-standing rule to sell an options position if it doubles within a day of purchase. That rule triggered just in time as CLF ended the day with a more modest 3.5% gain after the Fed finished.
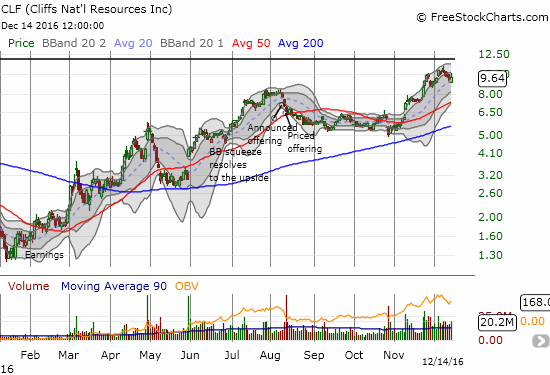
Cliffs Natural Resources is trying to hang onto support at its 20DMA uptrend.
The following charts of other select indices give some more perspective on the breadth of the pullback that ended the overbought period. In each case, the pullback looks like a pin prick relative to the extent of the post-election rally. The pullbacks are more significant relative to the 5-day overbought rally that preceded the Fed meeting.
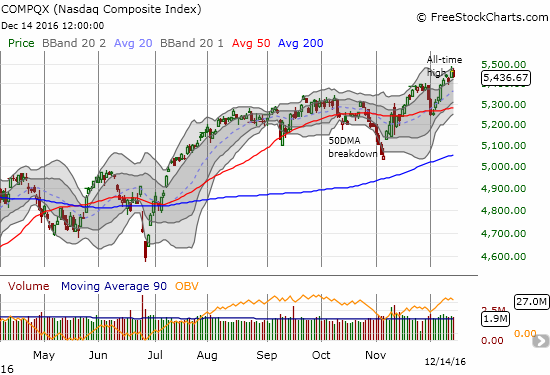
The Nasdaq (QQQ) lost 0.5% and reversed all of the previous day’s gains. The tech-laden index is still sitting comfortably between its upper-Bollinger Bands (BBs).
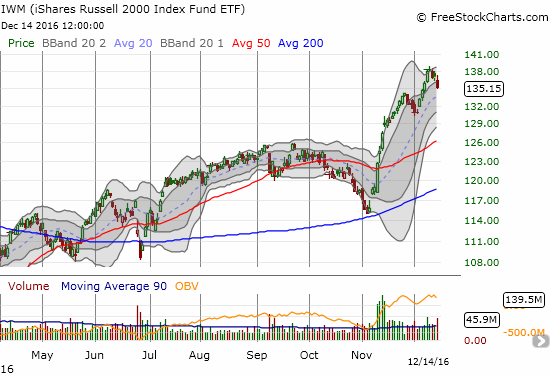
The iShares Russell 2000 (IWM) fell 1.25% and has now reversed almost a week of gains.
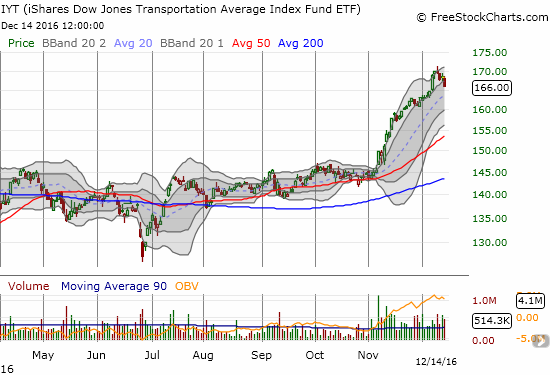
Is the party ending for the transports? The iShares Transportation Average (IYT) dropped 1.4% and looks ready to finish reversing last Wednesday’s impressive 1-day gain.
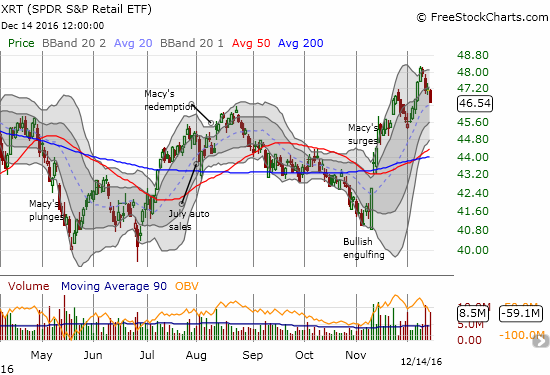
SPDR S&P Retail ETF (XRT) lost 1.2% and closed on its 20DMA uptrend. XRT has reversed a week of gains.
On an individual stock basis, I turned immediately to Caterpillar (CAT) which serves as one of my sentiment indicators. CAT lost a whopping 2.4% on the day, broke through 20DMA support, and closed at a 3-week low. The stock looks very toppy now.
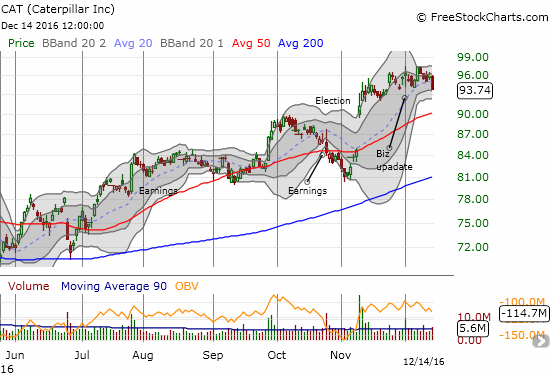
With a 3-week low, Caterpillar suddenly looks a lot more toppy.
These developments leave me in a bit of a sentimental bind. I fully expected to buy the dip from any post-Fed selling. Yet, my T2108 trading rules dictate that a fall from overbought conditions signals bearish trading conditions. So, I have gone ahead and reluctantly flipped the short-term trading call from cautiously bullish to cautiously bearish. Recall that I just downgraded to cautiously bullish thanks to a bearish divergence between T2108 and the S&P 500 going into the Fed meeting. Given that signal turned out to be correct, I need to stick to the discipline on the trading rules.
As a first test of this bearishness I decided to go after Apple (AAPL). Several big cap tech stocks followed through on the previous day’s strength and bucked the general weakness in the market. The put options I bought are thus a bet on a game of catch-up. For AAPL that could be as simple as a test of 50DMA support. Note that AAPL did manage to fade to flatline right at the close. AAPL is also over-extended with this fourth day of trading at some point above its upper-Bollinger Band.
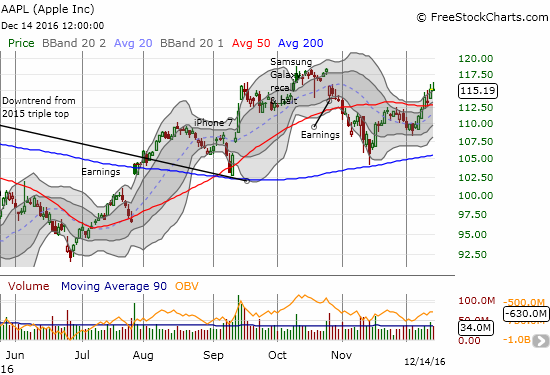
Apple looks ready to retest its 50DMA as support.
A confirmation of the bearish signal will take a lot more selling: for example, a complete reversal of the S&P 500’s one-day surge that launched the overbought period. By that time, however, the related sell-off may actually reach a point of exhaustion as the S&P 500 will trade right around support form the uptrend 20DMA. Moreover, the generally benign Christmas holiday trading is right around the corner. In other words, I have little reason to get outright bearish here. In fact, I think I am cautiously bearish looking for an excuse to buy the dip…stay tuned. (For more background on bullish read on market sentiment see “A Stock Market Positioned to Win A Battle of Sentiments: Taxation Versus Economic Optimism“).
Daily T2108 vs the S&P 500

Black line: T2108 (measured on the right); Green line: S&P 500 (for comparative purposes)
Red line: T2108 Overbought (70%); Blue line: T2108 Oversold (20%)
Weekly T2108

*
All charts created using freestockcharts.com unless otherwise stated
The charts above are the my LATEST updates independent of the date of this given T2108 post. For my latest T2108 post click here.
Related links:
The T2108 Resource Page
Be careful out there!
Full disclosure: long AAPL puts.


