
Stocks Finish The Week On A Winning Note
Finally, Stocks Rally
Stocks were stuck in a rut this week. There were a bunch of failed rally attempts. It’s demoralizing to give up gains so often. It made some investors wonder if the correction was still ongoing. The bears were out in full force predicting the next bear market and recession even though there’s little data to support that claim other than the high Shiller PE which isn’t a timing mechanism. It’s funny how the calls for a melt up were prevalent in January after stocks had run up so much and predictions for a recession came in February after the market fell. It’s important to not be manipulated by the headlines and gurus who give predictions to get attention. Notice, how I didn’t say to fade them. Sometimes they are actually correct, making them useless. It would be useful if they were always wrong.
The S&P 500 was up 1.6% on Friday. Now the stock market is only down 4.37% from the all-time high. It usually takes about a month to recover from normal corrections. I’m still bullish on stocks for the near term and the rest of the year. Once the market gets to the all-time high, I’ll be neutral on the near term. It’s simply about buying low and selling high. As I said would happen, the VIX has collapsed. It was down 11.91% to $16.49. The exact time when the short volatility trade unwound was actually the time when it made sense to short volatility. There was a point where the VIX was pricing in a 2% move everyday for the next month. It didn’t take a genius to figure out that wasn’t going to happen, but it did take courageous conviction to act on the trade in the midst of the chaos.
The 10 year bond yield sold off again on Friday as it fell 5.47 basis points to 2.866%. This is going exactly as I predicted. I still think the yield will fall further in the next month. If you thought the stock market would rally because of this decline, you were rewarded. However, I think it’s a coincidence. At some point when corporate bonds sell off, there will be a decline in earnings because firms will need to spend more money to service their debt. However, that’s still not an issue just yet. I don’t believe there is a corporate debt bubble because debt to GDP isn’t an adequate measure now that firms are so expansive.
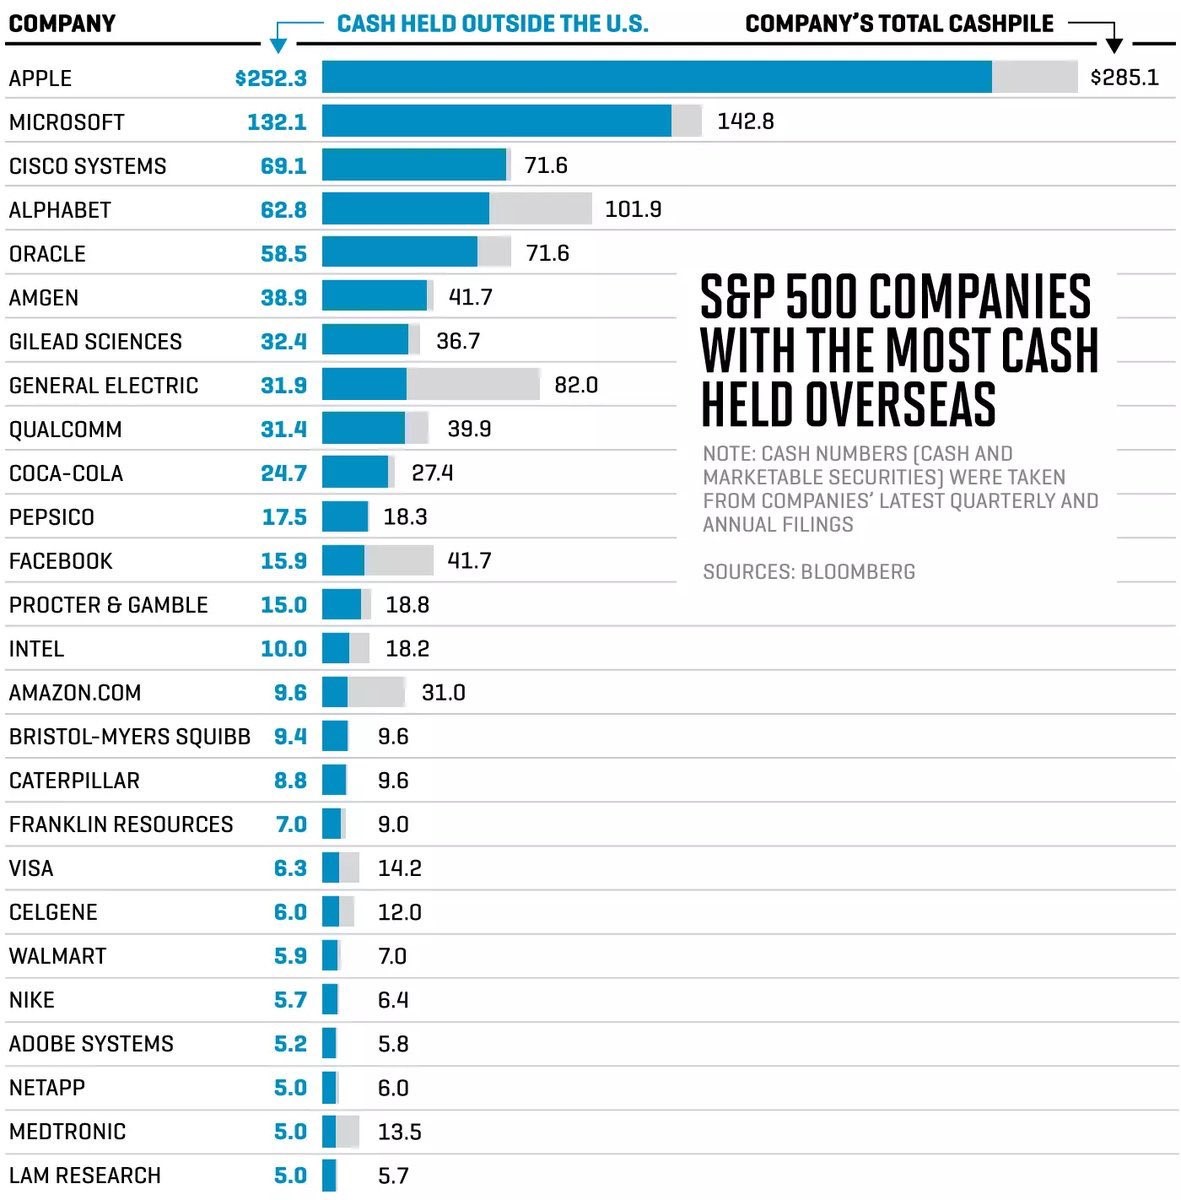
Firms With The Most Cash Overseas
The chart below shows the S&P 500 firms with the largest cash overseas. This situation has played a role in inflating the debt to GDP. Firms like Apple have issued debt in America, backed by foreign profits, to pay dividends and buyback stock. This action was taken to avoid paying the high U.S. tax rate. Now that these firms are going to repatriate the capital at the new lowered rate, the debt will decrease because some of the capital will go towards paying it back. The top 5 firms on this list are all tech names. As I mentioned previously, even though tech is one of the sectors least affected by the lowered tax rate, it is one of the most helped by the repatriation holiday as many tech firms get most of their profits from international markets.
(Click on image to enlarge)
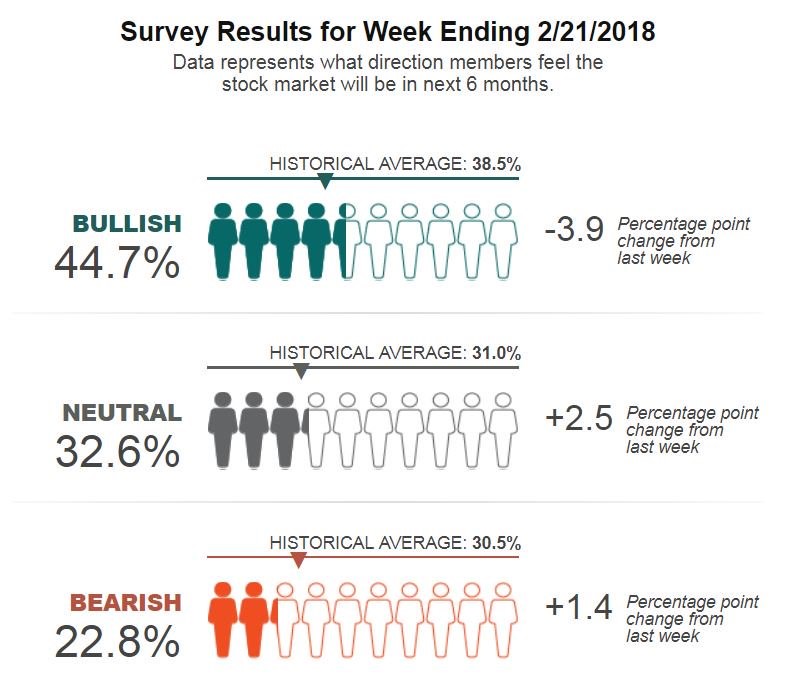
Sentiment Comes Down
One of the indicators that told me the stock market was overheated in January was retail investor sentiment. Optimism about the stock market reached a record high. That’s an obvious tell that a correction is coming. The graphic below shows the latest results from a sentiment survey. As you can see, there are about 6% more bulls than average and about 8% less bears than average. The results came in line a bit more than last week. The market should go up because of earnings growth. However, it can easily get overheated because the bull market is 9 years old, making investors too euphoric. Investors don’t remember the 2008 crash. It’s dangerous when the momentum gets as strong as it was in January. It would be a very bearish sign if stocks rose that quickly the whole year. There could be a larger than 50% correction during the next recession if that rally pace restarts.
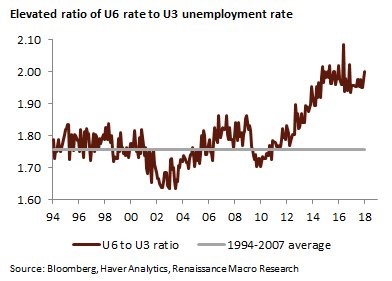
Labor Market Not Full
The biggest debate among economists is whether the labor market is full. According to the jobless claims and unemployment rate, it’s full. However, the wage growth and 25-54 age employment ratio say otherwise. The chart below supports the latter point. As you can see, it shows the U6, which is the underemployment rate, compared to the U3, which is the headline rate. This ratio is meant to show that the U6 rate is too high compared to the U3 when you look at the previous 2 cycles. If the U6 needs to come down 1% from here, it will take a few quarters. This is the slack in the labor market which will keep away sharp wage inflation and postpone the next recession by 2-3 years.
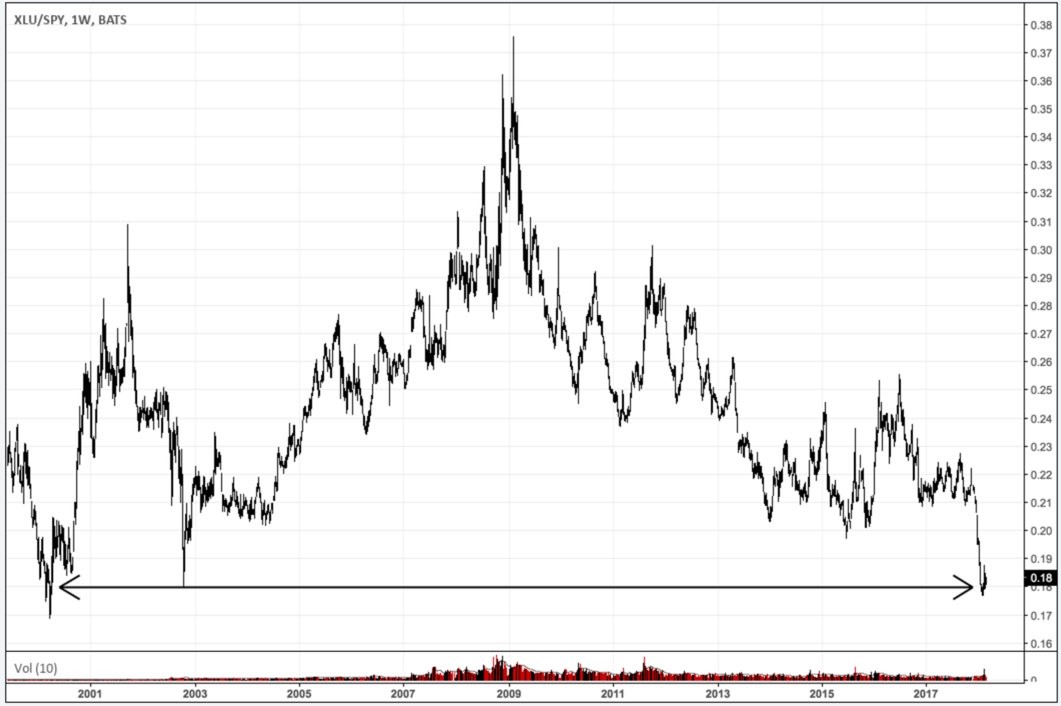
Utilities Are Getting Destroyed
The utilities have had a rough year. The sector has the highest mean absolute daily change in 2018. That’s remarkable because the utilities are supposed to be a safe sector. They are being hurt by the increase in treasury yields. As you can see from the chart below, the sector has the lowest ratio compared to the S&P 500 since 2000. That’s obviously a bad sign because the market crashed in 2000. I think utilities are being hurt by the rising yields and the fact that the market is ‘risk on.’ I also think structurally utilities should make up a lower percentage of the market than in prior cycles because the tech sector has grown so large. Everything is becoming tech and these behemoths have the earnings to justify their valuations. Since I think ‘risk on’ and higher rates will continue in the next year, I think this ratio will fall. The time to buy utilities is probably in 18 months.
(Click on image to enlarge)
Disclaimer: Neither TheoTrade or any of its officers, directors, employees, other personnel, representatives, agents or independent contractors is, in such capacities, a licensed financial ...
more

