
Stock Valuations Stabilize, Flirt With Normal Range
Rising Up
Valuations Hover Just Below Normal Range
ValuEngine tracks more than 7000 US equities, ADRs, and foreign stock which trade on US exchanges as well as @1000 Canadian equities. Using our Valuation Model, we can currently assign a VE valuation calculation to more than 2800 stocks in our US Universe.We combine all of the equities with a valuation calculation to track market valuation figures and use them as a metric for making calls about the overall state of the market.
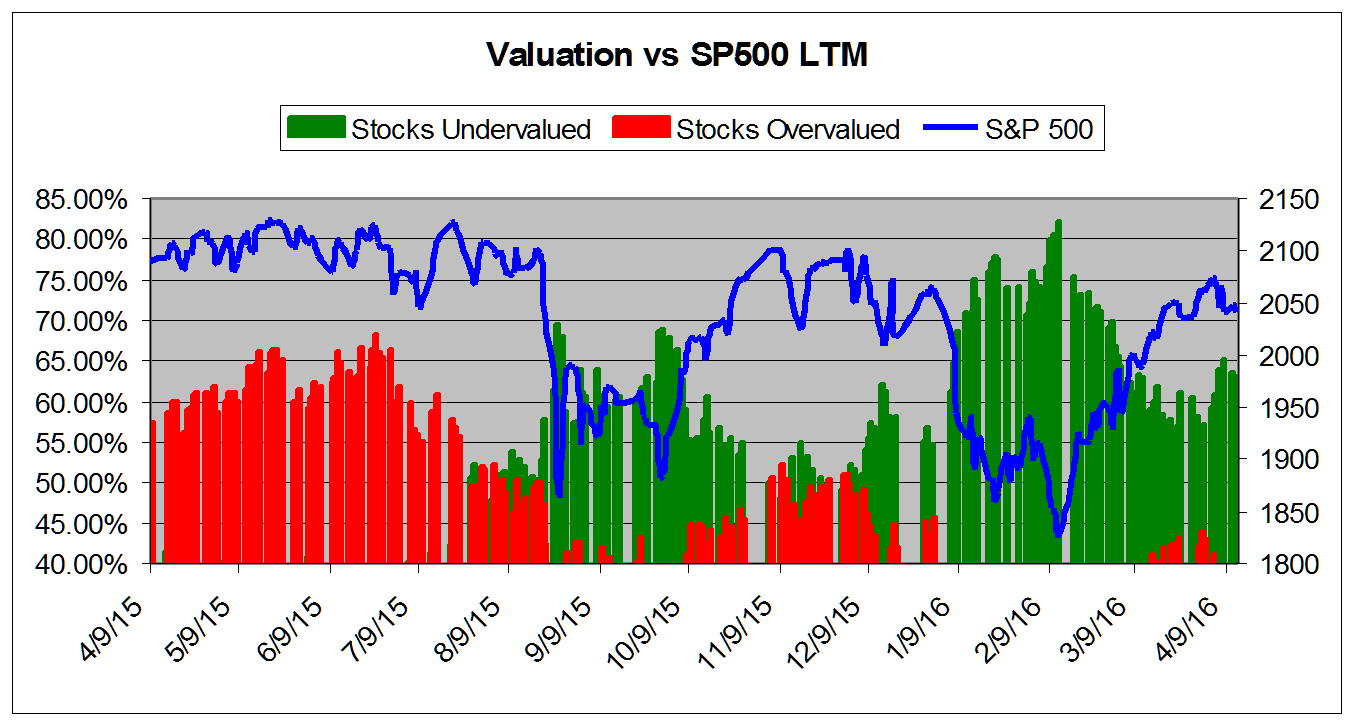
We now calculate that 36.99% of the stocks we can assign a valuation are overvalued and 11.57% of those stocks are overvalued by 20% or more. These numbers are pretty much identical to what we saw the last time we published our valuation study at the beginning of March. We saw values climbing well into "normal" range--between 40-60%--during the market rally since then, but they have declined a bit with the latest pull back..
In case you hadn't noticed, the US is in a presidential election cycle, which has often correlated to a good year for stocks in the past. However, this year we see a variety of challenges. Every bit of good news about the US economy gets negated by something in China, or on the world-wide commodities markets, or in the energy sector, etc.
We need to wait and see what happens this cycle. We remain confident that if the Fed manages to curb its appetite for rate increases in order to allow US workers to benefit from the recovery--finally--we will see decent growth here. Of course, this pre-supposes election results which do not end up in new austerity measures, government shut downs, etc.
The chart below tracks the valuation metrics from April 2015. It shows levels in excess of 40%.
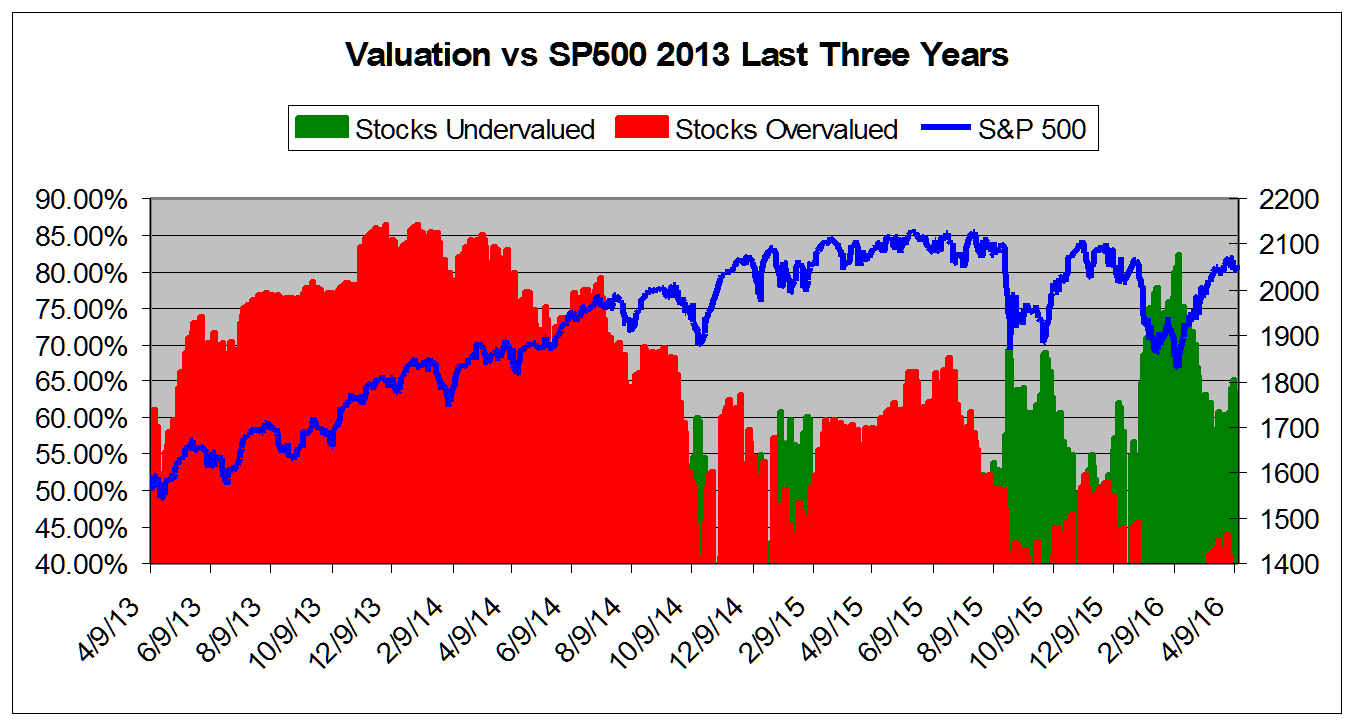
This chart shows overall universe over valuation in excess of 40% vs the S&P 500 from April 2013
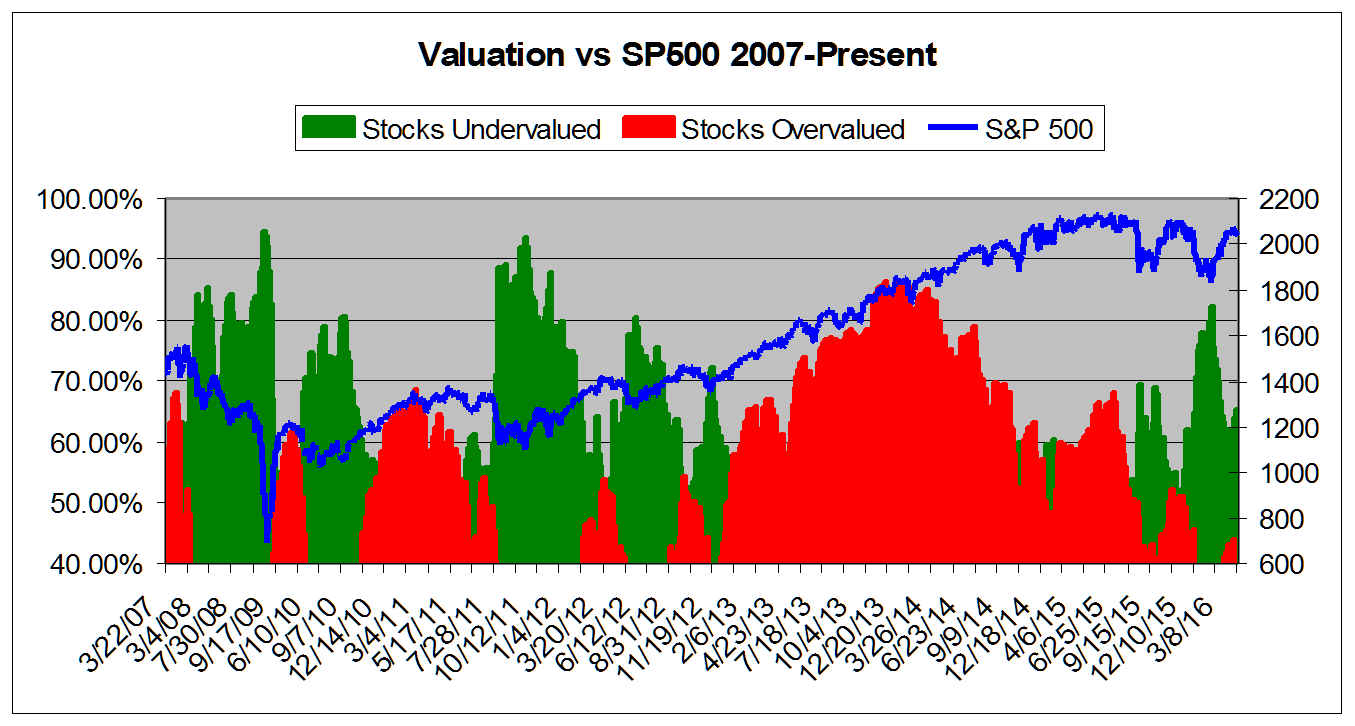
This chart shows overall universe under and over valuation in excess of 40% vs the S&P 500 from March 2007* *NOTE: Time Scale Compressed Prior to 2011.
ValuEngine Market Overview
|
Summary of VE Stock Universe |
|
|
Stocks Undervalued |
63.01% |
|
Stocks Overvalued |
36.99% |
|
Stocks Undervalued by 20% |
28.02% |
|
Stocks Overvalued by 20% |
11.57% |
ValuEngine Sector Overview
|
Sector |
Change |
MTD |
YTD |
Valuation |
Last 12-MReturn |
P/E Ratio |
|
-0.45% |
2.74% |
3.47% |
7.90% overvalued |
-1.69% |
23.23 |
|
|
0.90% |
3.42% |
1.83% |
6.27% overvalued |
-0.09% |
24.77 |
|
|
0.25% |
8.34% |
11.31% |
1.82% overvalued |
-7.47% |
26.02 |
|
|
0.16% |
6.69% |
0.57% |
0.77% overvalued |
-15.93% |
19.19 |
|
|
0.50% |
5.57% |
0.60% |
1.94% undervalued |
-14.81% |
17.70 |
|
|
0.45% |
2.89% |
0.99% |
4.19% undervalued |
-10.00% |
26.12 |
|
|
1.21% |
3.14% |
-4.40% |
5.10% undervalued |
-12.23% |
18.63 |
|
|
0.39% |
3.52% |
-2.12% |
5.14% undervalued |
-12.26% |
21.42 |
|
|
0.41% |
3.48% |
-0.71% |
6.67% undervalued |
-8.90% |
24.09 |
|
|
0.28% |
3.51% |
-4.05% |
6.95% undervalued |
-7.98% |
15.31 |
|
|
0.37% |
3.48% |
-0.33% |
7.57% undervalued |
-12.71% |
22.31 |
|
|
0.71% |
13.20% |
2.90% |
8.62% undervalued |
-36.69% |
22.15 |
|
|
0.37% |
4.79% |
-0.68% |
11.11% undervalued |
-7.46% |
18.72 |
|
|
0.65% |
9.03% |
-2.32% |
11.40% undervalued |
-20.70% |
12.14 |
|
|
0.84% |
4.64% |
-1.54% |
13.50% undervalued |
-24.46% |
12.62 |
|
|
0.13% |
3.47% |
-11.04% |
14.81% undervalued |
-24.45% |
25.87 |
VALUATION WATCH: Overvalued stocks now make up 36.99% of our stocks assigned a valuation and 11.57% of those equities are calculated to be overvalued by 20% or more. Four sectors are calculated to be overvalued.
Disclosure: None.
Disclaimer: ValuEngine.com is an independent research provider, producing buy/hold/sell recommendations, ...
more

