
Stock Market Decision Point
In NFTRH 327 we noted that the markets were at a decision point, sitting in a neural zone for the short-term. An example of this neutrality being the S&P 500, nestled just above the 50 day moving average, MACD red (crossed down by weekly charts), RSI green and a sloppy looking pattern that has not made a higher high to the early January high.

Meanwhile, the momentum leader, Biotech has been full bull. The market is bifurcated, when considering other items like the bearish looking Internet sector (ref. weekly chart of DJINET).

While the Banks have been bearish for a while now. That October low is just not just any low on a daily chart. It is the decider on whether or not the Pigs enter a new cyclical bear market (as viewed by weekly chart support, which we have kept tabs on in NFTRH). So it’s kind of important, wouldn’t you say?

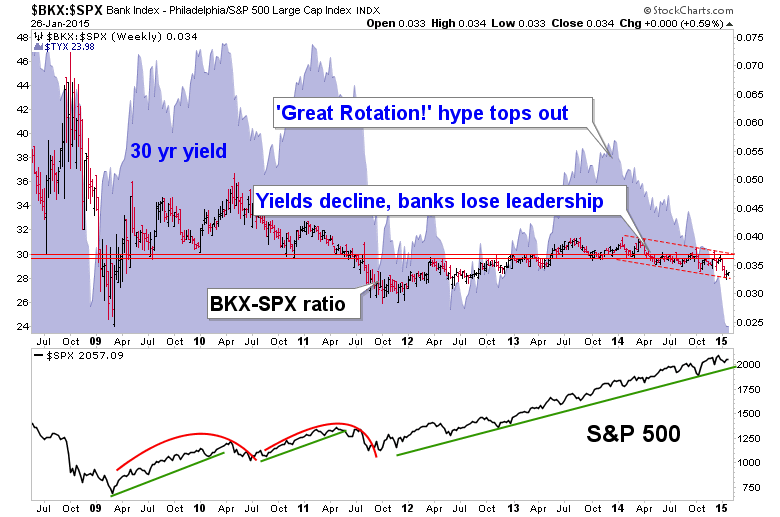
Here’s the Bank leadership chart we also review continually (with long-term T bond yields, which are important for banks). Leadership was surrendered a year ago, yet robo market has continued upward.
This is just a snippet view of the market. There are a million more charts I could haul out for more perspectives. But one not so technical point I’d like to make is that the market had better get it in gear and make a decision out of this bifurcated state or outliers like the BTK notwithstanding, things are probably going to swing bearish, given this morning’s futures.
Subscribe to NFTRH Premium for your 25-35 page weekly report, interim updates (including Key ETF ...
more

