Chart analysis is one of the most widely misunderstood forms of financial market forecasting. It has been around for centuries, and Charles Dow, the founder of The Wall Street Journal and creator of the Dow Jones Industrial Average, was the first prominent chart analyst in North America during the late 19th century. He realized that financial market behavior is a reflection of both rational data, such as economic activity and earnings growth, and irrational human emotions, such as greed and fear. In order to develop reliable forecasts for future market behavior, it is necessary to understand and analyze both the rational and the irrational drivers of market prices, and the thoughtful application of chart analysis provides the ability to do precisely that.
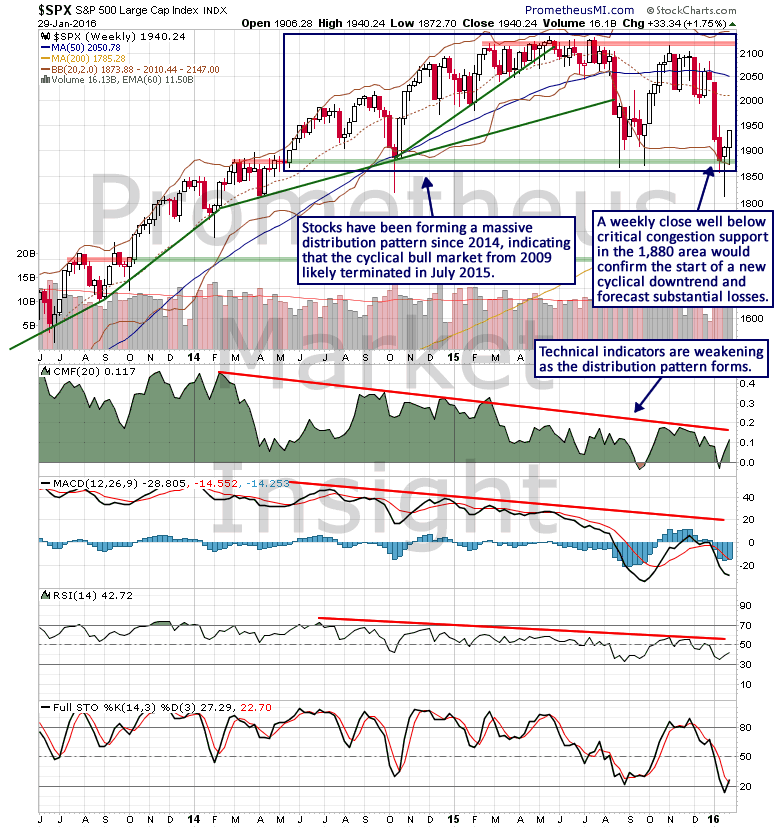
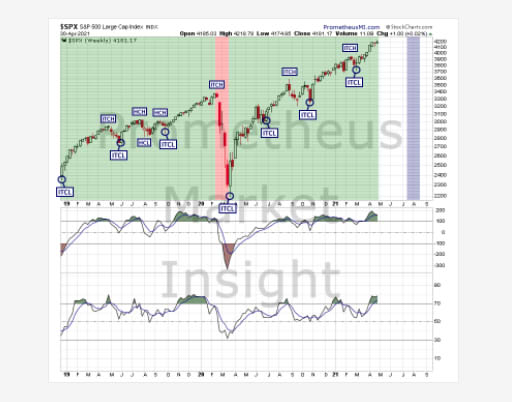
For seven months, the stock market has been exhibiting signs of weakness and signaling the likely termination of the speculative cyclical bull market that began in 2009. Last weekend, we noted that the developing cyclical top in the stock market had entered an important phase. The massive distribution pattern that has been forming since 2014 indicates that the bull market likely terminated in July of last year and a weekly close well below critical congestion support in the 1,880 area on the S&P 500 index would essentially confirm the start of a new bear market and forecast substantial losses.
|
|
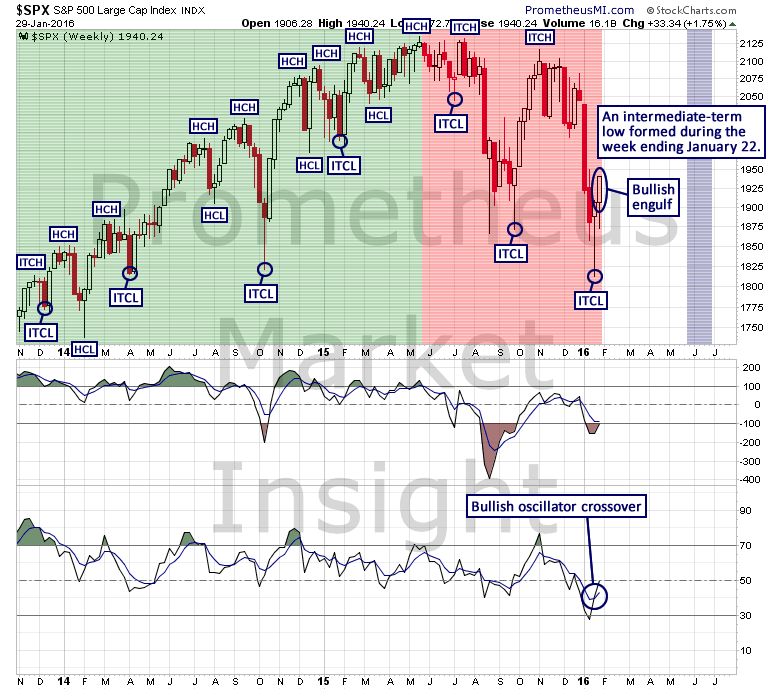
One week ago, our computer models identified the potential formation of an intermediate-term low in the stock market, and this week a cycle low signal was nearly generated, confirming that a new intermediate-term cycle has begun.
|
|
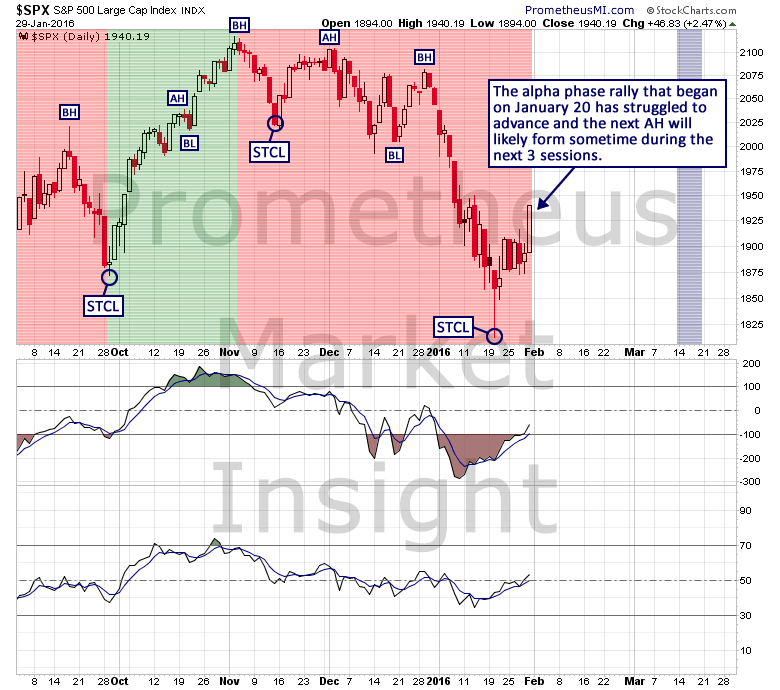
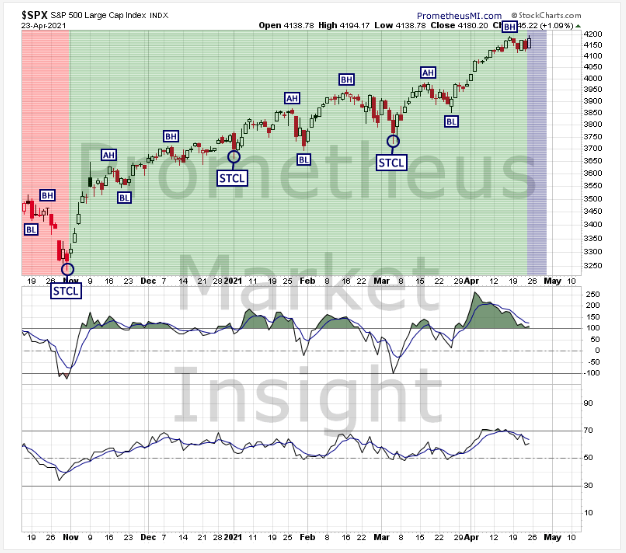
The intermediate-term cycle has had a bearish translation since May of last year, so it is likely that the rally from last week will terminate sometime during the next three weeks. From a short-term perspective, the initial rally of the current cycle is seven sessions old and it has struggled to advance following the violent reversal on January 20. The latest alpha high (AH) will likely form sometime during the next 3 sessions, after which the forthcoming alpha phase decline will likely return to recent lows.
|
|
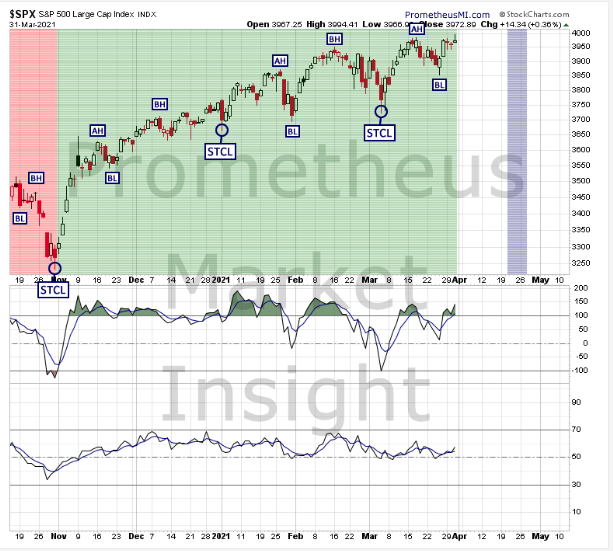
As we often note, a long-term reversal in the stock market is a process, not an event. Since June of last year, market behavior has signaled the likely formation of a long overdue cyclical top, and we are now on the brink of a breakdown that would confirm the start of a bear market and forecast substantial losses during the next 12 to 18 months. Therefore, it will be important to monitor market behavior closely during the next several weeks.
Comments
Log in or sign up to join the conversation.