Wednesday, June 17, 2015 12:38 PM EDT
Even though I’ve been charting for decades, I am still in awe of how some of the simplest methods can be helpful.
Trendlines, which are by definition the simplest drawn object even possible, are a favorite example. Check out crude oil’s front month, shown below. This is an important chart to me, because I have so many energy-related shorts. Oil was surging last night, but look at where it peaked: at precisely (virtually to the penny) the descending trendline, which represents resistance.
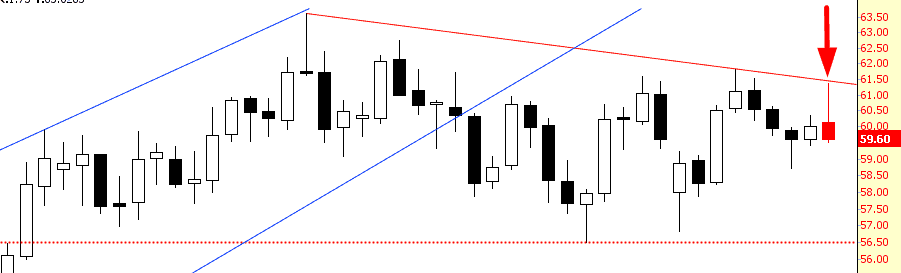
Of course, the real “break” I want is a failure of the 56.51 horizontal line. A failure of that support means it’s party time, at long last.
This blog is not, and have never been, investment advice. It is a place that allows me to express my own views on the market and specific securities – as well as make whatever cultural ...
more
This blog is not, and have never been, investment advice. It is a place that allows me to express my own views on the market and specific securities – as well as make whatever cultural observations or other odds and ends strike me as worth writing about. So I take absolutely no responsibility for the losses – or any credit for the gains – you may or may not make from reading this forum. Whether you lose your life savings or make a fortune is entirely up to you and your own skills/luck/fate.
Please note I am the principal of Tim Knight Organization, LLC, a California-registered investment adviser. The content of the postings and investment strategies and discussions provided herein do not necessarily reflect the views, opinions or policies of Tim Knight Organization, LLC and Tim Knight Organization, LLC makes no warranties regarding the accuracy of their content or their completeness.
less
How did you like this article? Let us know so we can better customize your reading experience.


