
SPX, Gold, Oil And G6 Targets For The Week Of September 18th
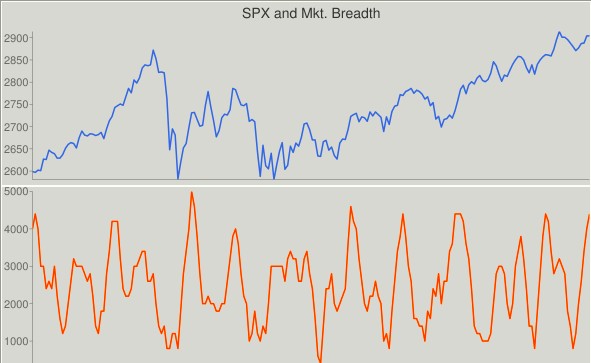
Once again, extreme market breadth levels, coupled with a CIT date proved to be a powerful mix resulting in a 40+ point SPX swing. That wasn’t enough, however, to propel the index to new highs, and the SPX stalled at the projected high target.
As a result, we’re stuck in a trading range. Since market breadth is currently overbought, betting on an immediate sustained breakout to new highs is a low odds play.
The last couple of weeks we focused on an easy way to insert price targets into your workflow. This week we’ll introduce a tool for unbiased and objective wave detection and monitoring.
Rather than being based on wishful thinking, subjective interpretation, or predetermined count quota and nomenclature, CIT Waves are grounded in strict rules and simple principles which can be summarized as follows: In an uptrend, bullish waves/swings should last longer and gain more points than bearish counter-trend waves/swings. The opposite is true for bearish waves /swings. As long as the length of directional swings is longer than the length of counter-trend swings, a directional movement/wave is in progress. You can use CIT Waves as a stand-alone indicator, or as a confirmation tool for your own wave count and analysis.
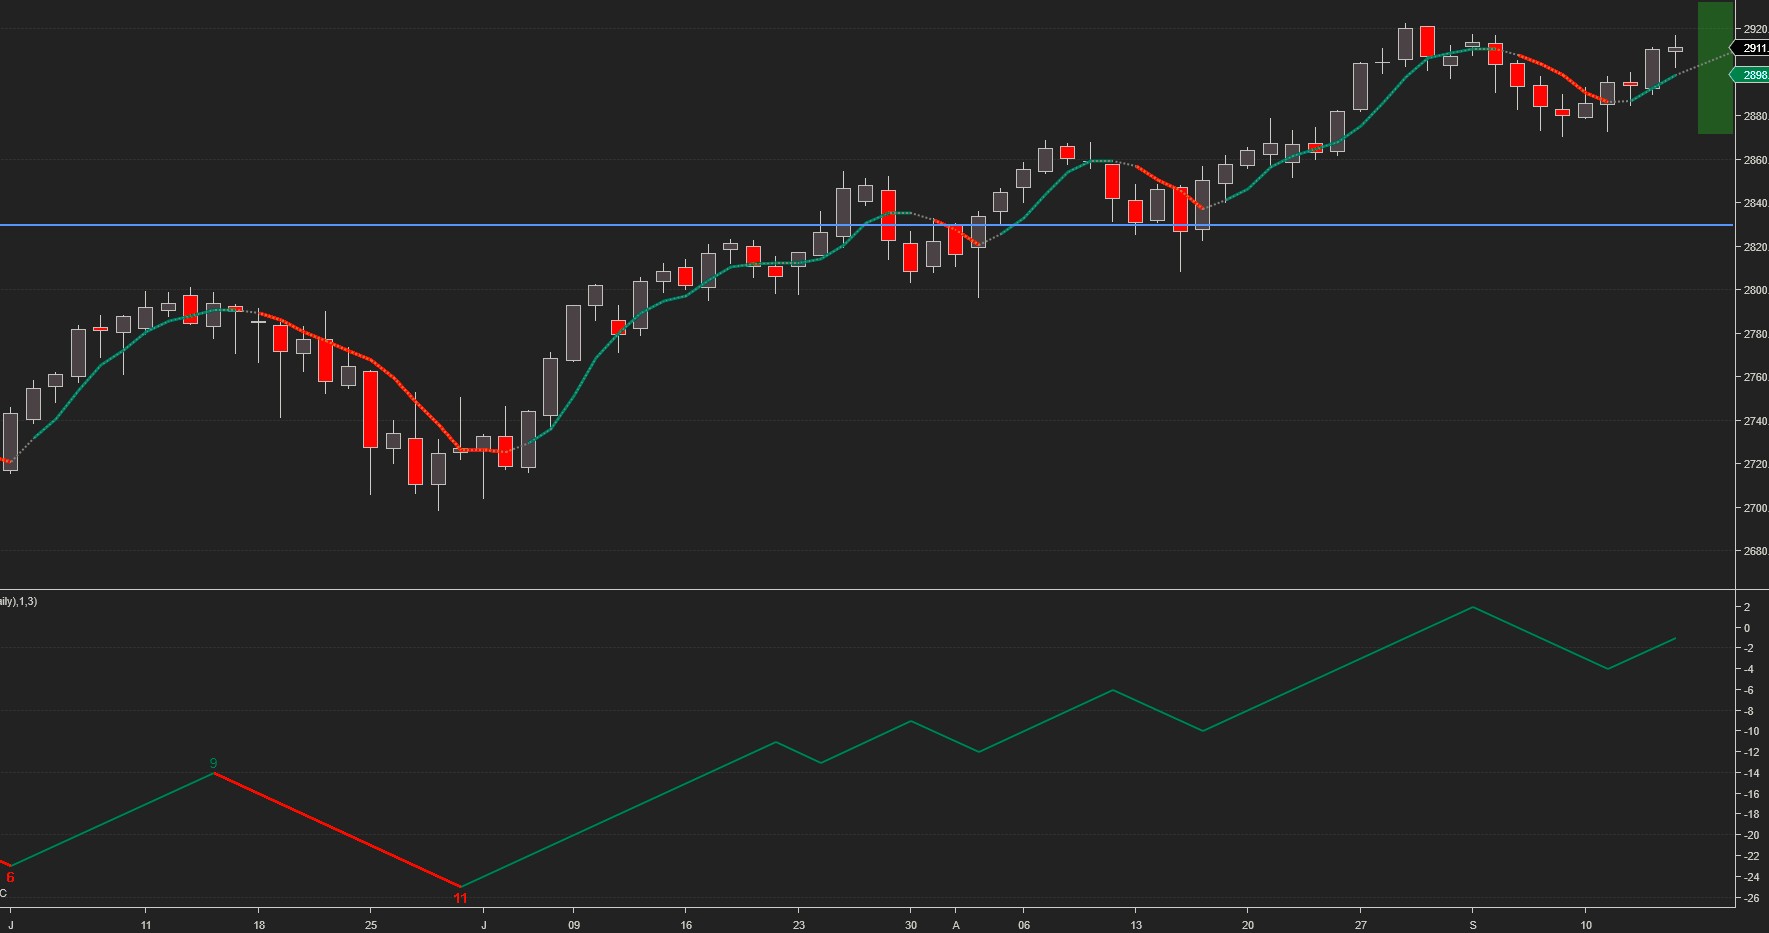
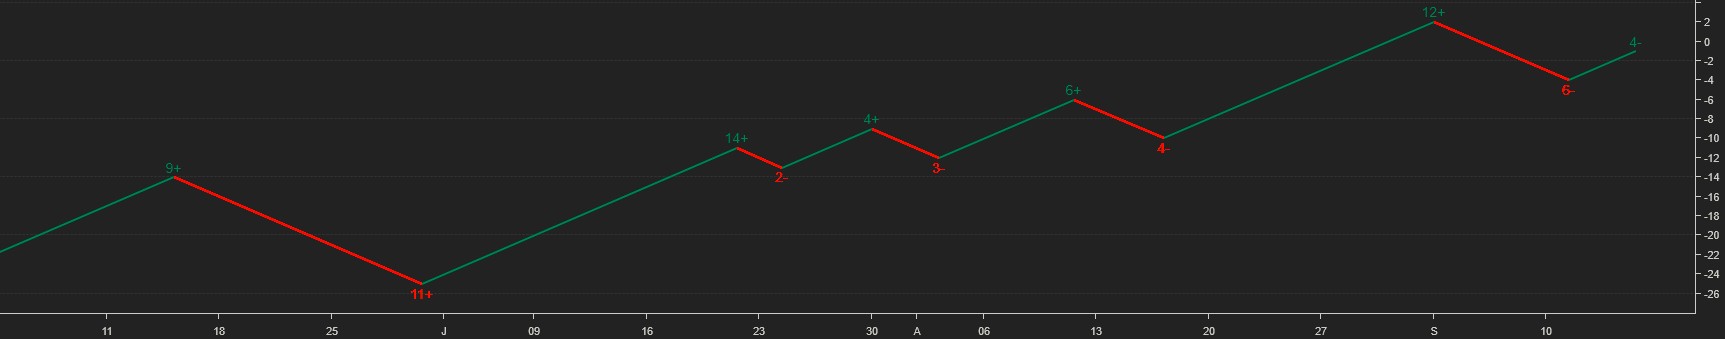
This abstract notion is best illustrated by the SPX chart below. Since the beginning of July, upswing duration and points gained have exceeded downswing duration and points lost, resulting in an uninterrupted bullish wave. If the current upswing fails to exceed 6 bars, however, this will signal that the bullish wave may be coming to an end.
The projected trading range for next week for SPX is 2870-2933:
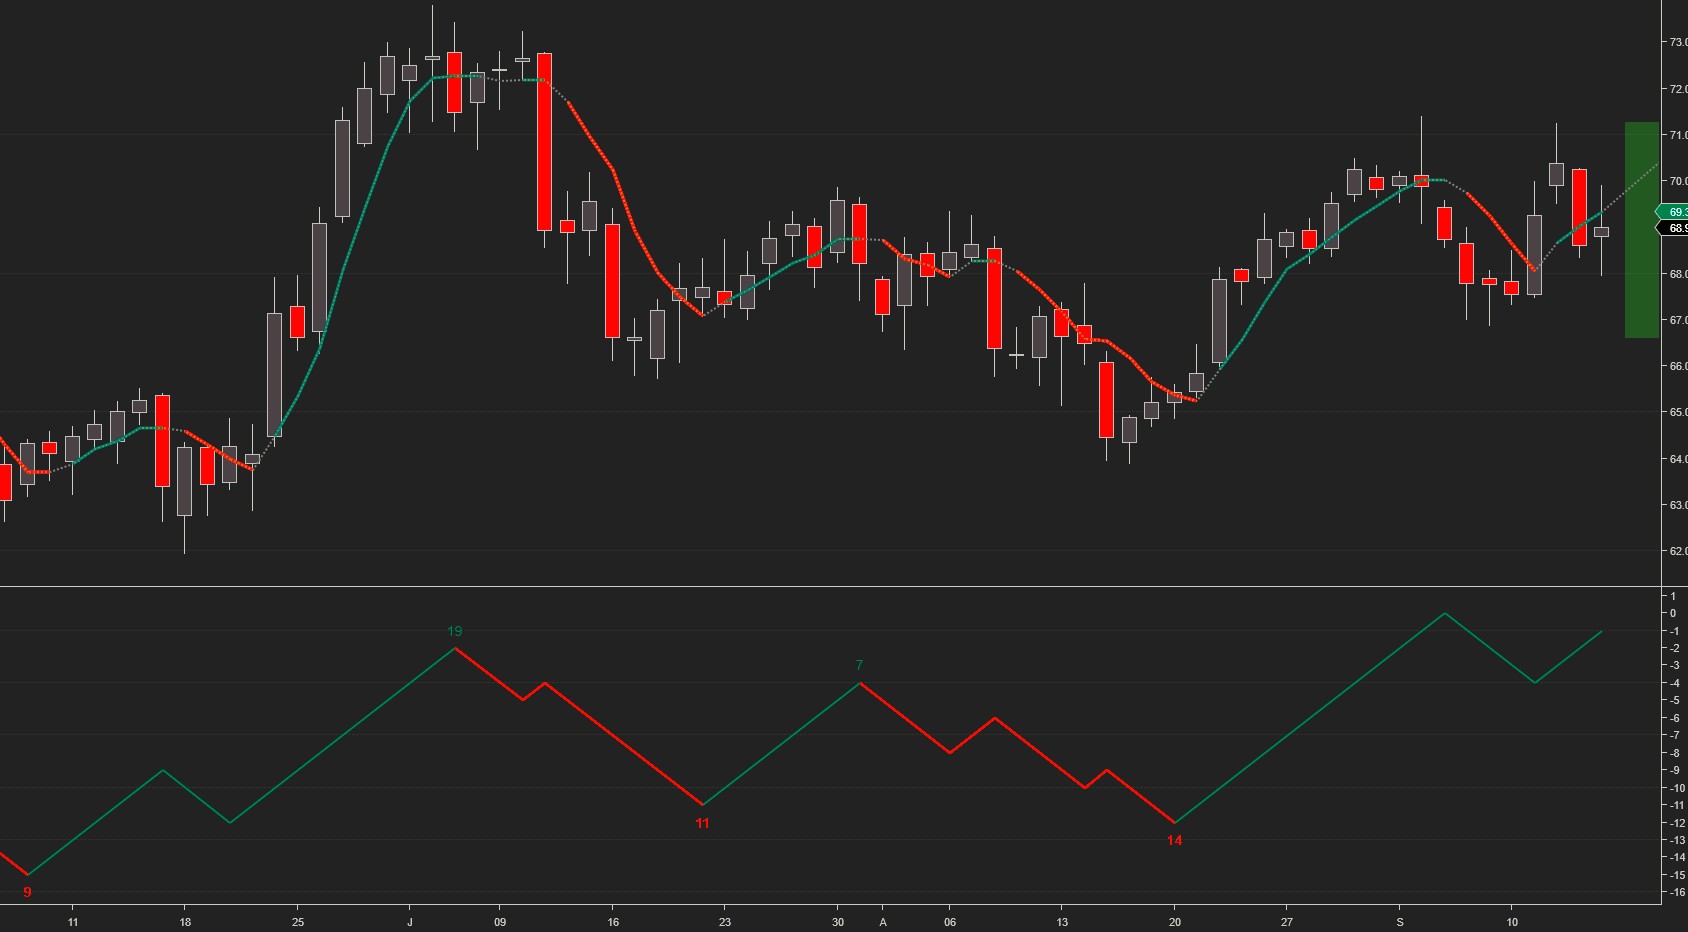
Oil has been stuck in a $64 – $74 trading range since April 2018. Last week it reached and briefly exceeded our upside target only to pull back and finish in the middle of the projected trading range.
The projected trading range for oil for next week is 66.5 – 71.5.
Monthly pivots: P – 69.9, S1 – 67.5, S2 – 63.3, R1 – 72.3, R2 - 74
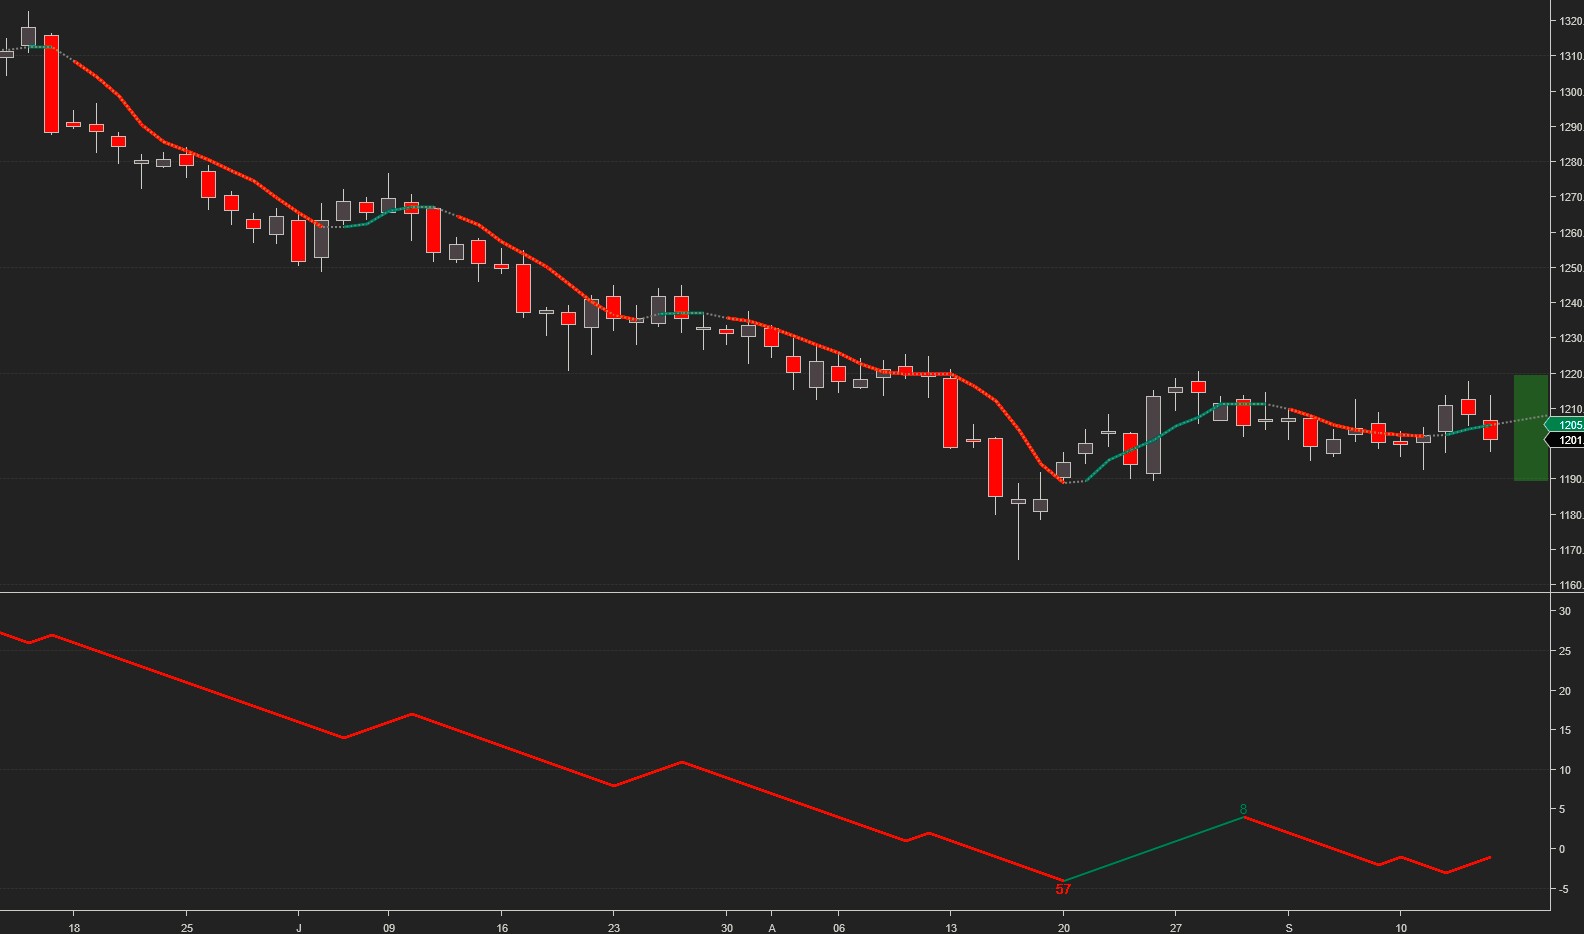
Gold continued trading in a narrow trading range, bouncing around the pivot line, and the projected trading range remains the same.
Monthly pivots: P - 1205, S1 - 1180, S2 – 1160, R1 – 1230, R2 - 1250
The projected trading range for gold for next week is 1190 - 1220:
All G6 pairs hit our targets.
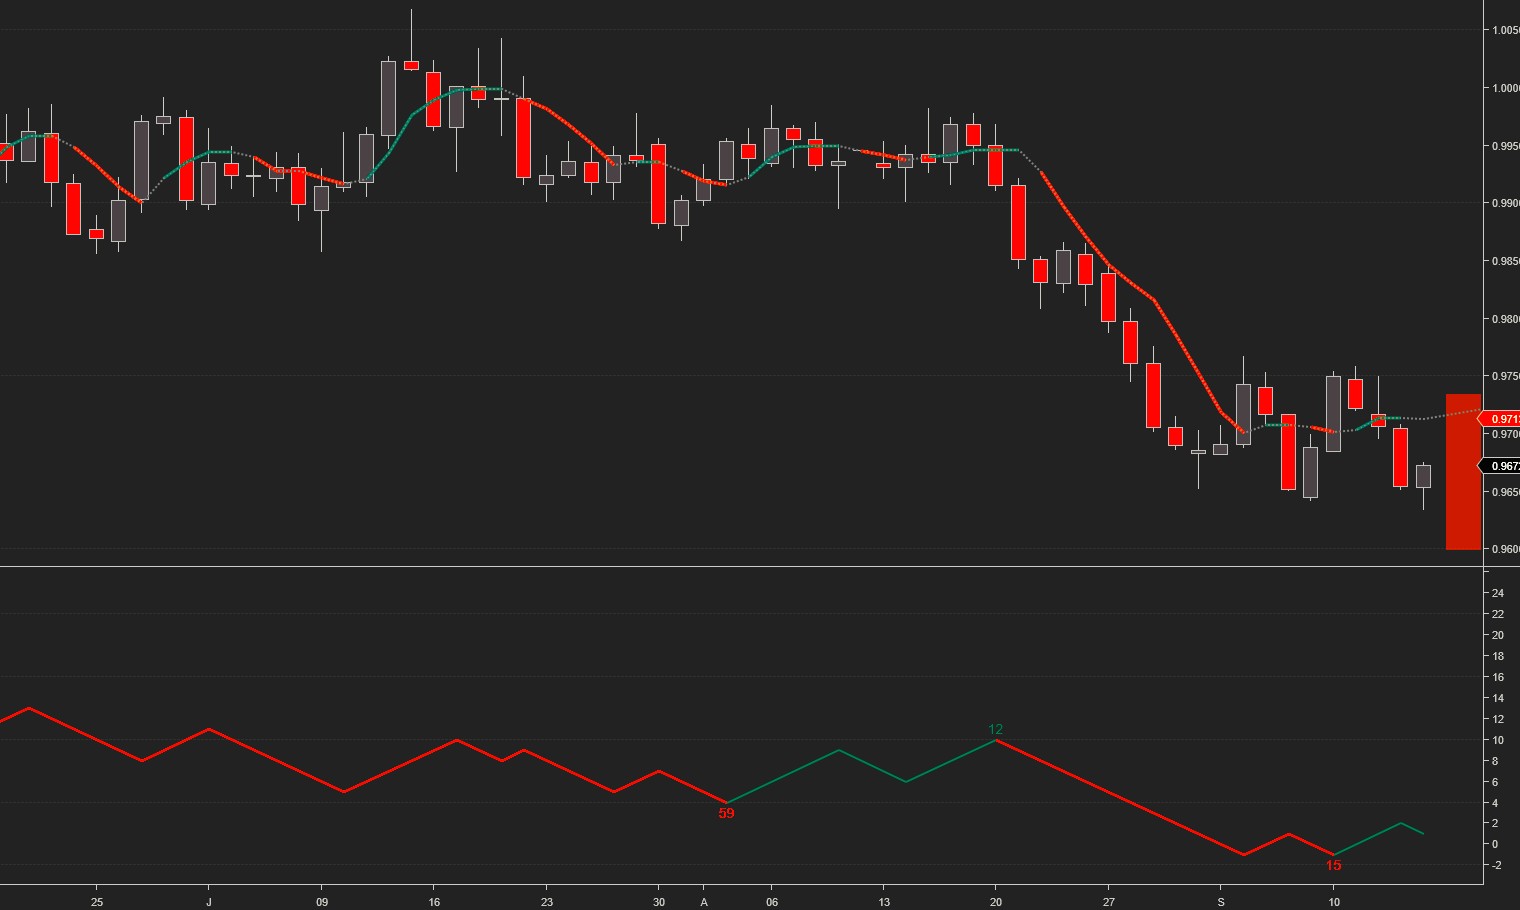
USDCHF once again hit our upside target and reversed, still trying to find a bottom between the .382 and .5 retracement of the January – May upswing.
Monthly pivot at 0.97
The projected trading range for USDCHF for next week is 0.96 – 0.975:
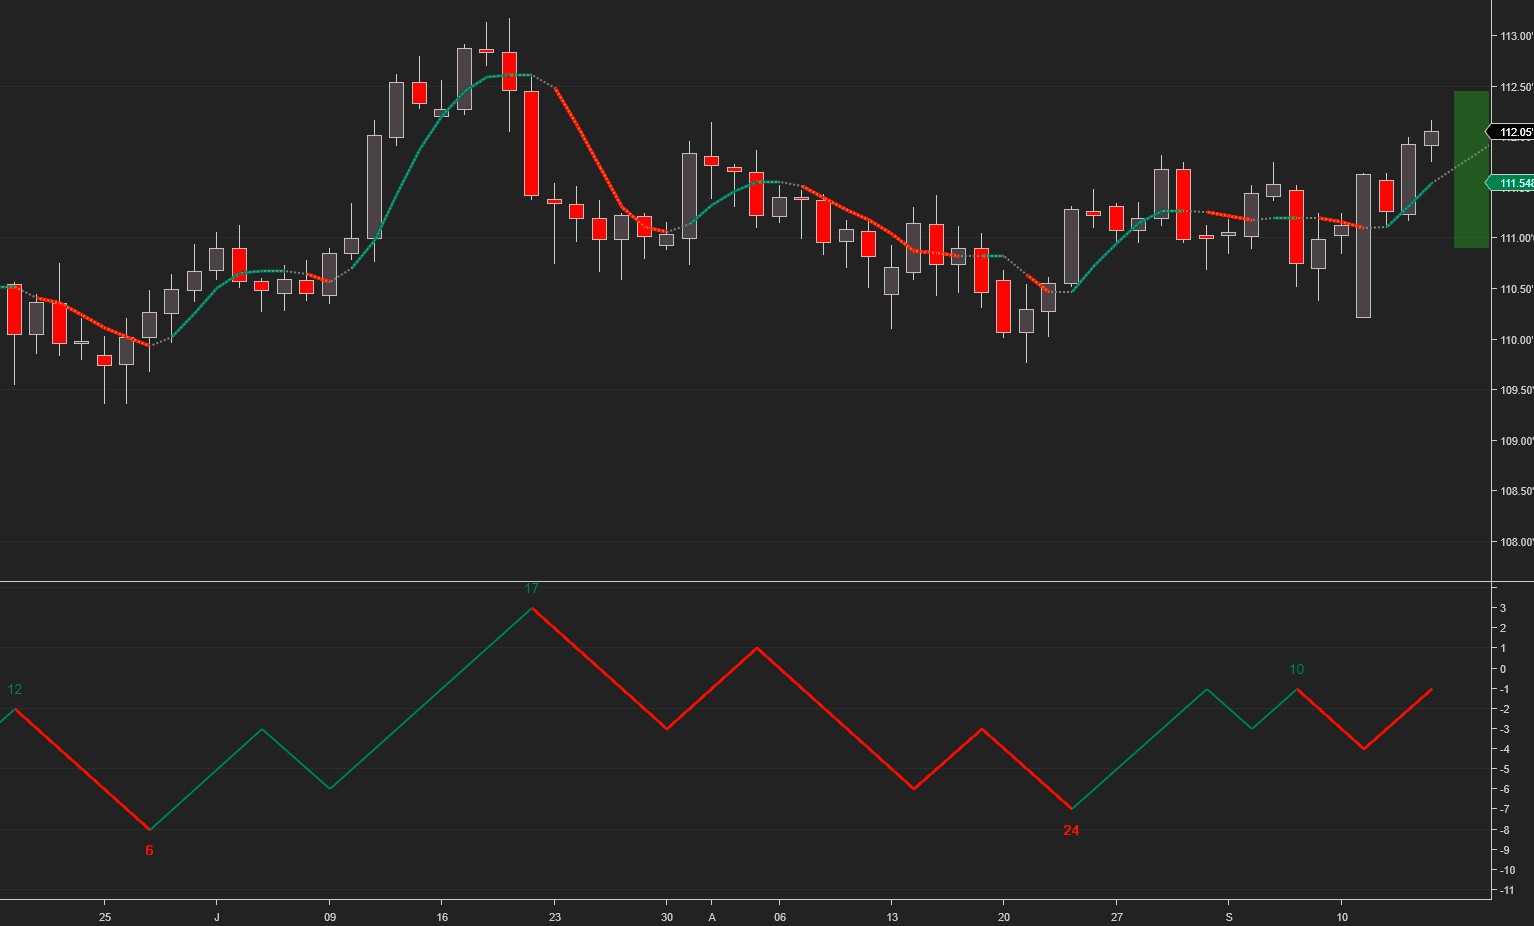
USDJPY tested our upside target several times and finished the week slightly higher.
Monthly pivot at 111.1
The projected trading range for USDJPY for next week is 111 – 112.5:
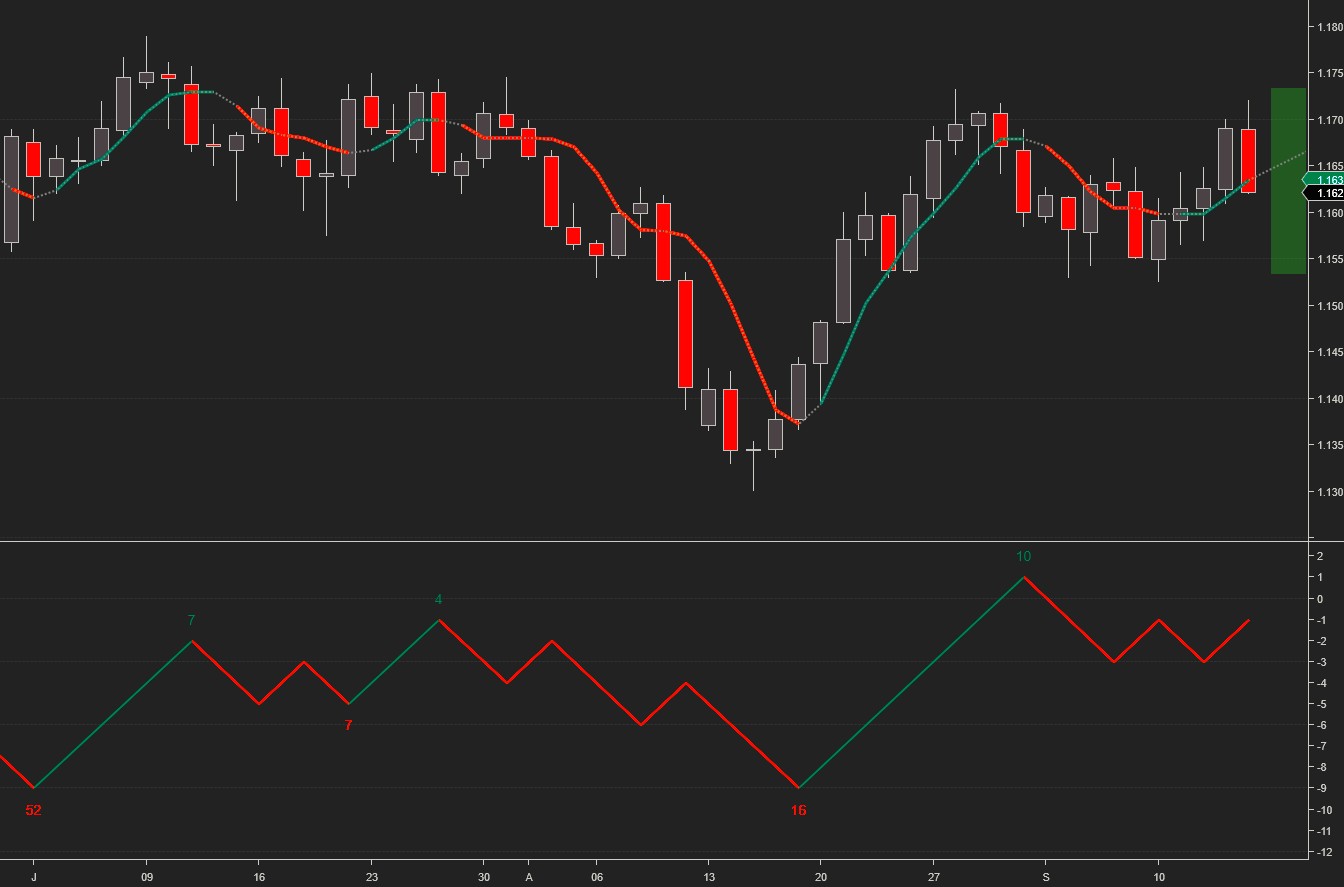
EURUSD reached our upside target and reversed sharply at the end of the week, breaking below the bullish target angle.
Monthly pivot for EURUSD at 1.16
The projected trading range for EURUSD for next week is 1.153 – 1.173:
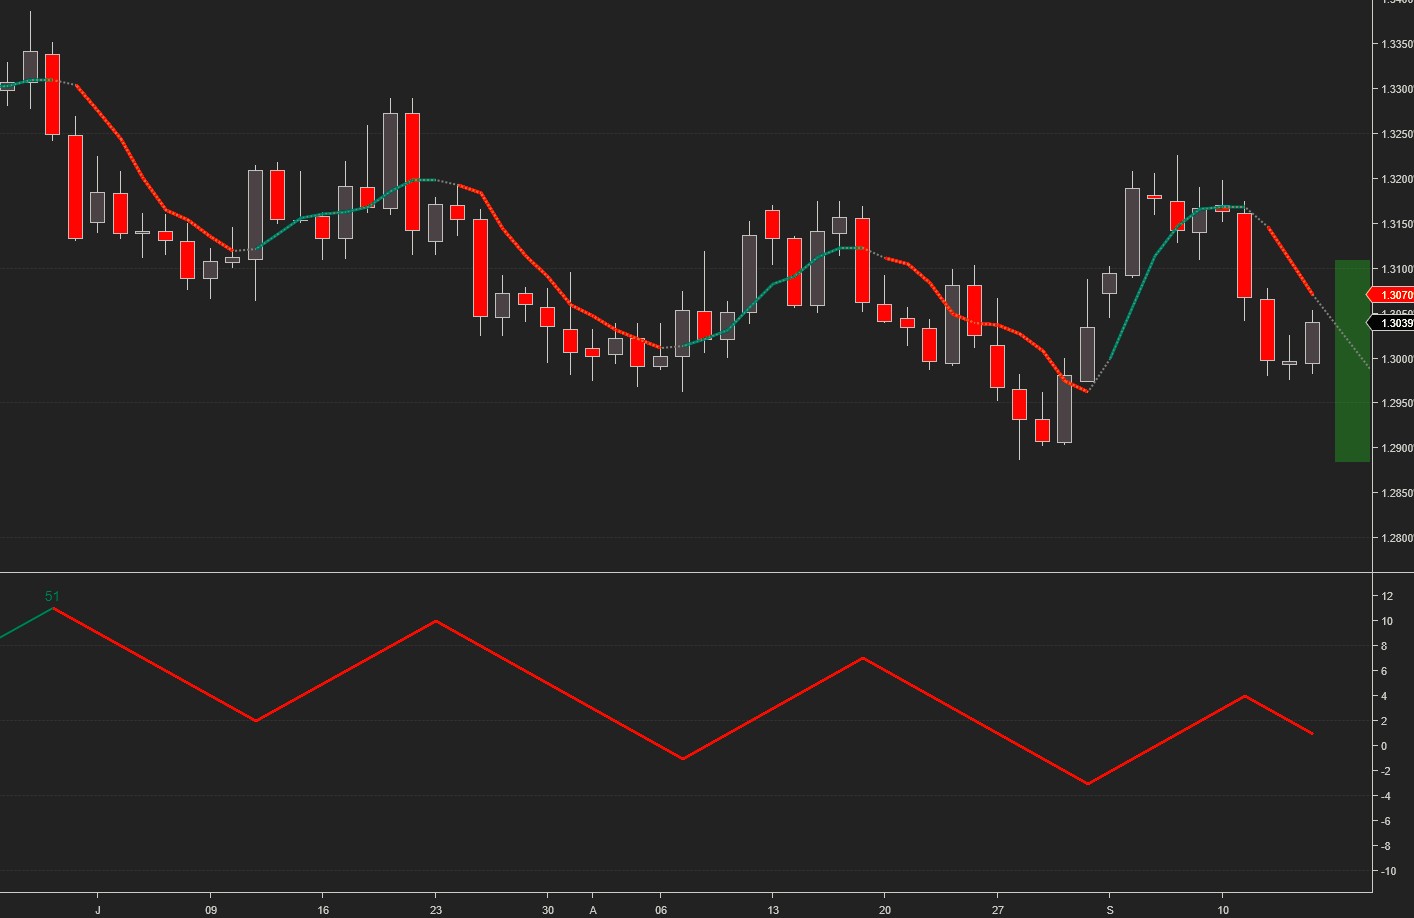
GBPUSD remained above the bullish target angle all week long. The upside target was exceeded on Thursday, but that was followed by a sharp retracement, which brought the GBP back to the pivot line.
The monthly pivot line is at 1.29.
The projected trading range for GBPUSD for next week is 1.278 – 1.302:
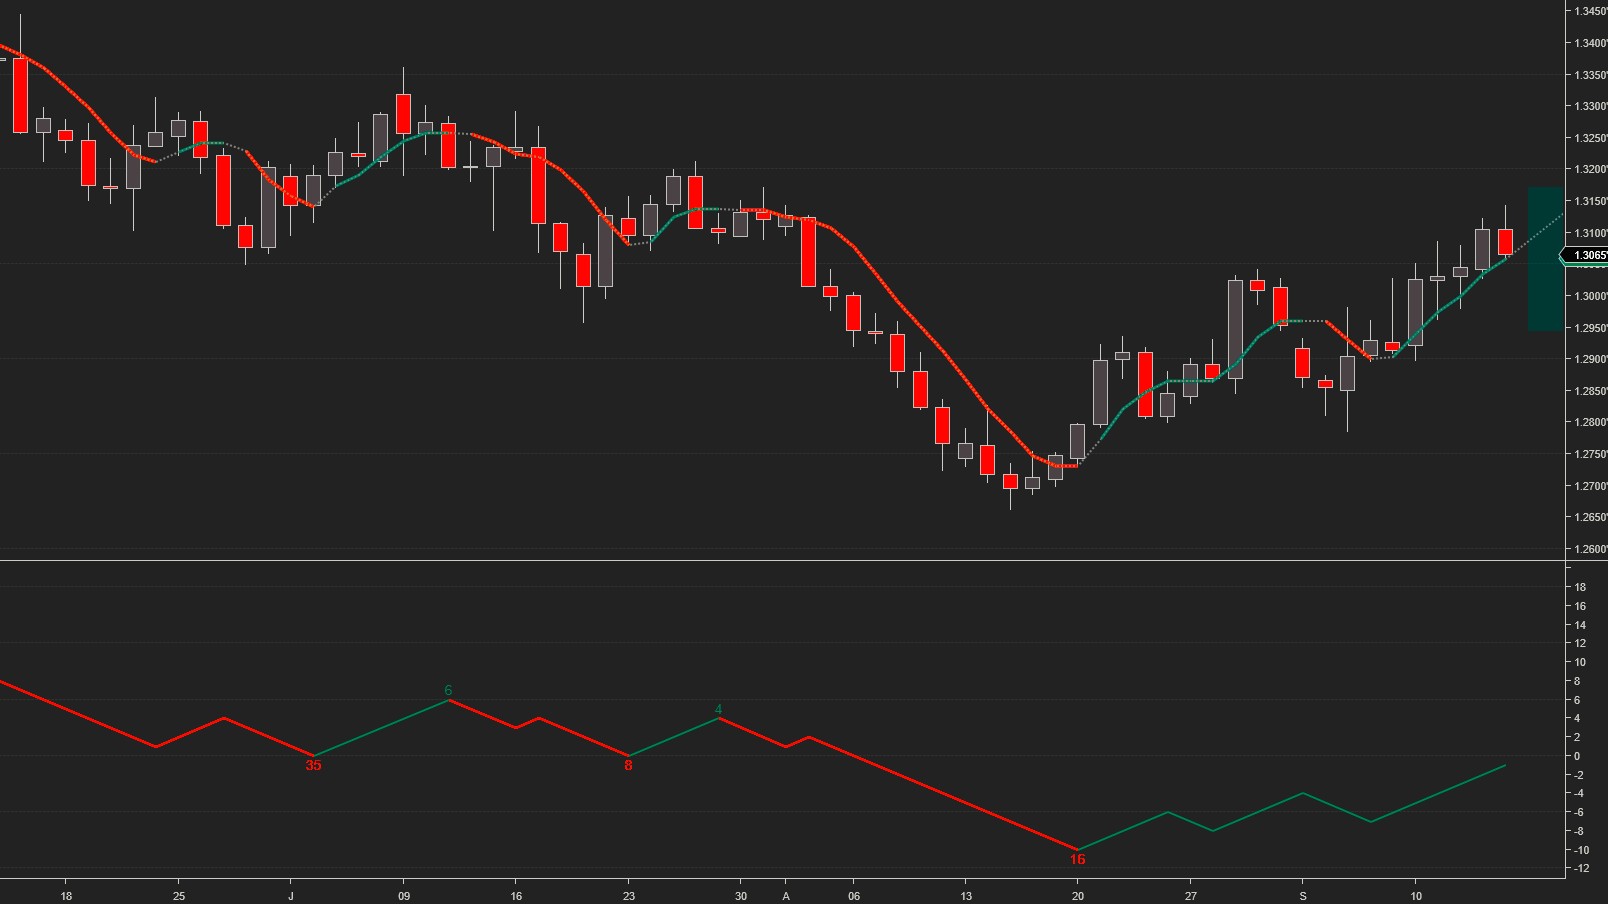
The USDCAD bullish trend came to an end, as the pair broke below the bullish target angle and finished the week at the lower target. The long-term trend remains down.
Monthly pivot at 1.307
The projected trading range for USDCAD for next week is 1.288 – 1.311:
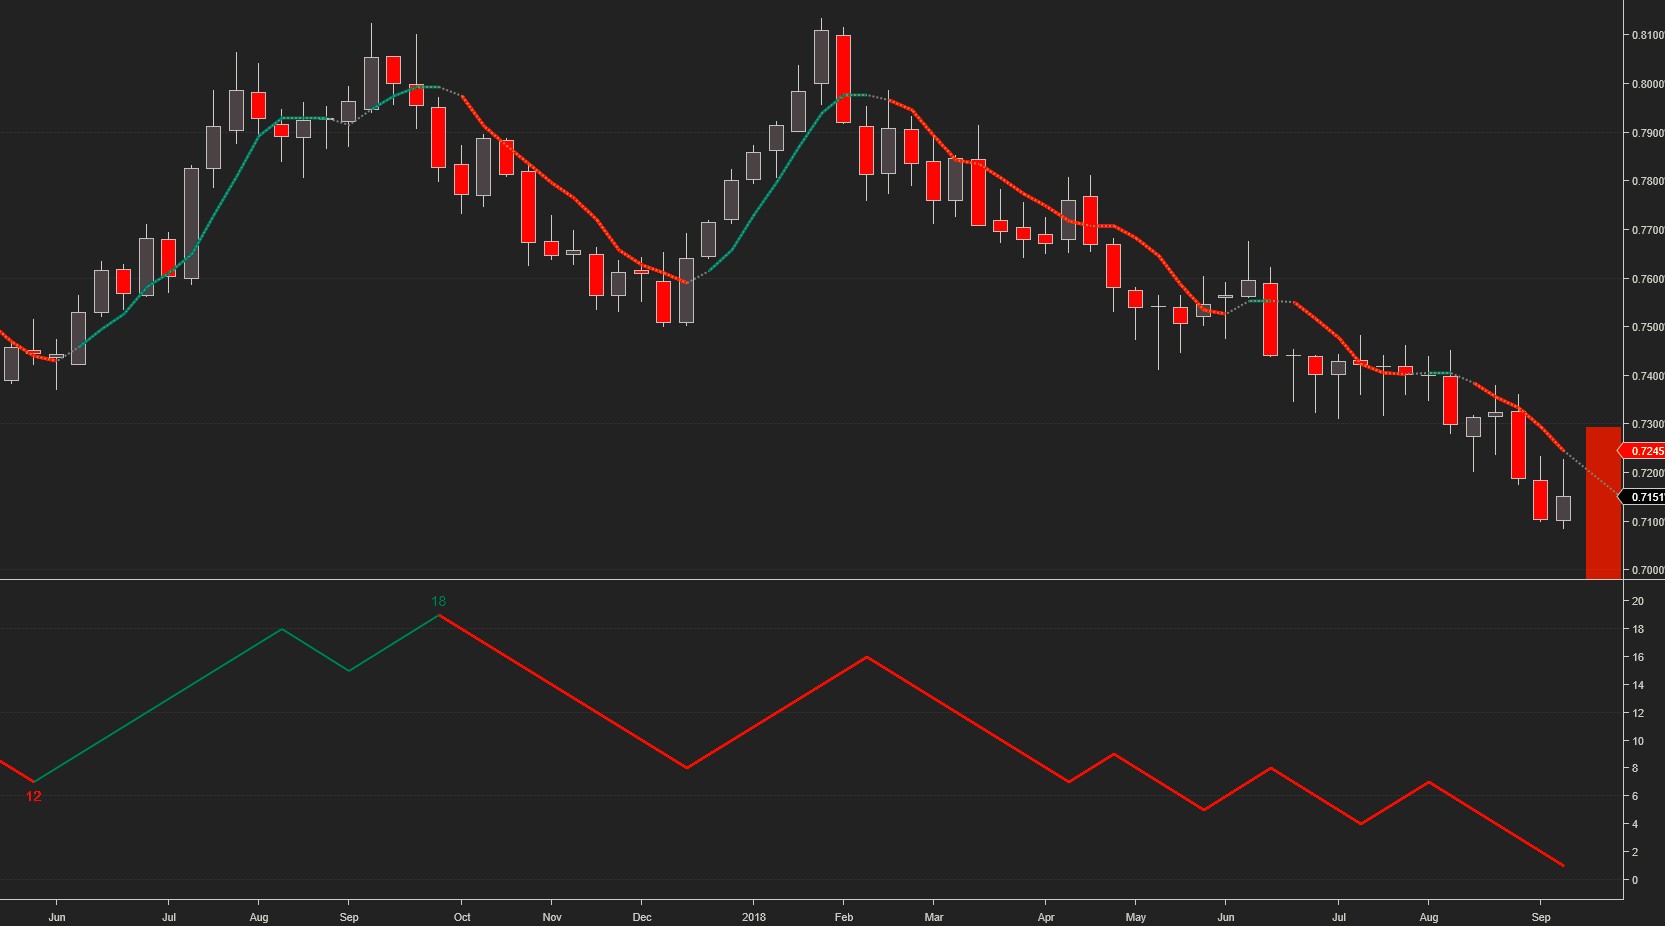
AUDUSD tested the upside target and reversed sharply down. As mentioned before, the long-term weekly trend is sharply down, and the lower projected targets continue pointing in the same direction.
Monthly pivot line at 0.7184.
The projected trading range for AUDUSD for next week is 0.706 – 0.723.
Please note that this is a weekly chart:
Charts, Signals and data courtesy of OddsTrader, CIT for TradingView and NinjaTrader 8
Disclaimer:Futures and forex trading contains substantial risk and is not for every investor. An investor could potentially lose all or more than the initial investment. Risk capital is money that ...
more

