
SPX, Gold, Oil And G6 Prices For The Week Of August 27
The SPX remained on a buy signal and reached our upside target, making a new all-time high in the process. The upside target for this week is 2893, and the index will remain on track to achieve this target as long as it trades above the CIT Cloud and the 1 x 1 angle:
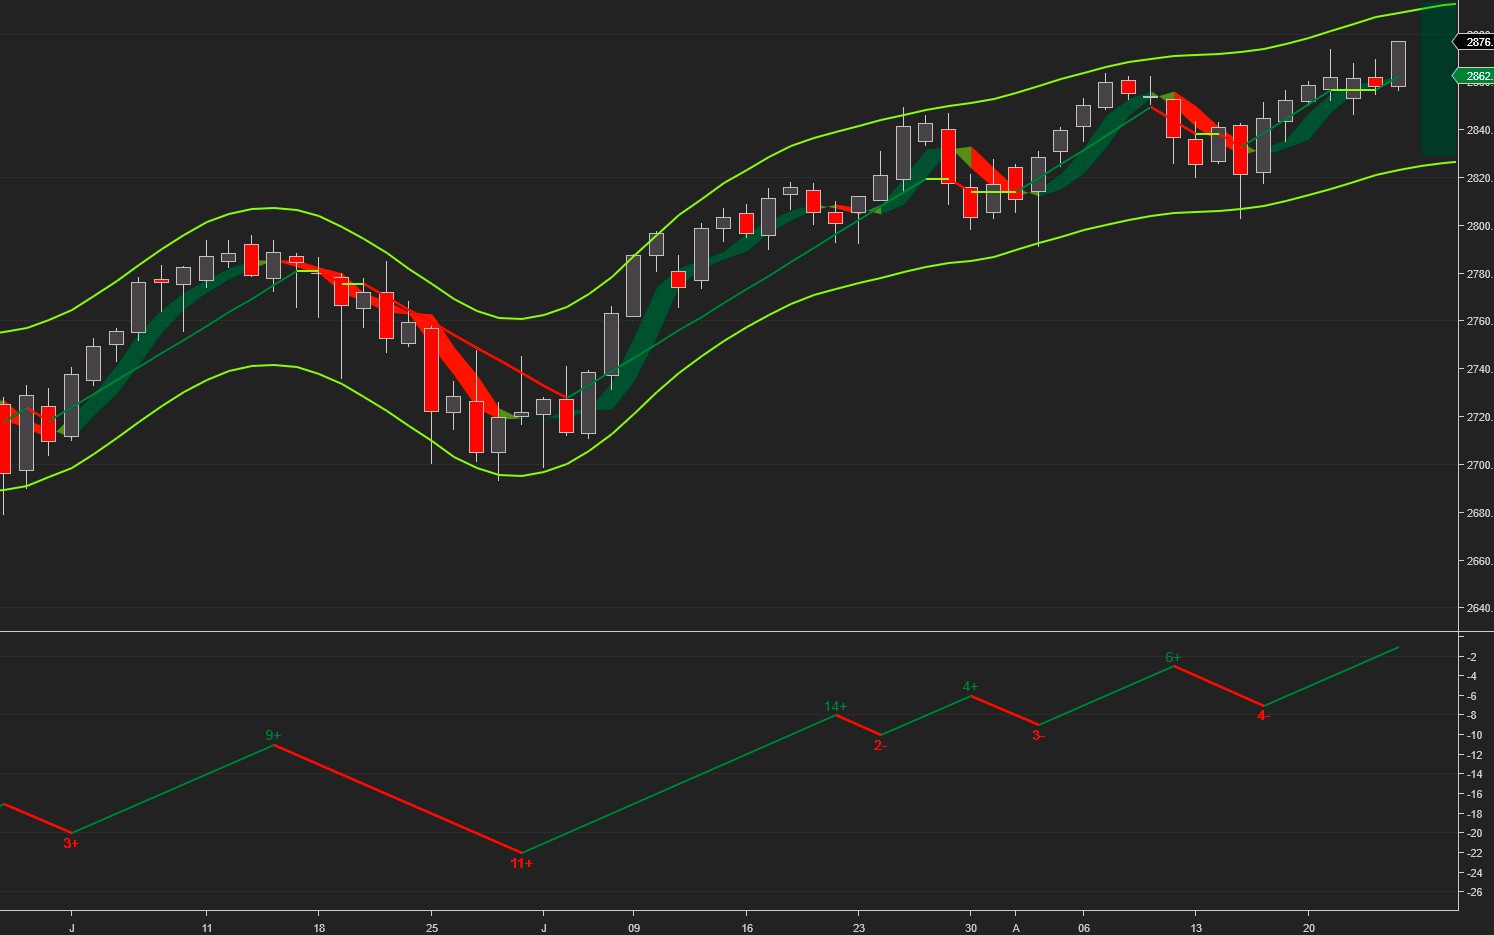
While discussing the CIT Waves indicator at the bottom, we noted that the current upswing needs to exceed 6 bars and/or make a new high to confirm that the July uptrend remains uninterrupted. Both conditions were met, thus validating that the uptrend remains in place.
We also looked at years when the SPX made a first high in January, and they show a strong 76+% correlation with the current market. The red line is the historical average of these years, the white line is the SPX:
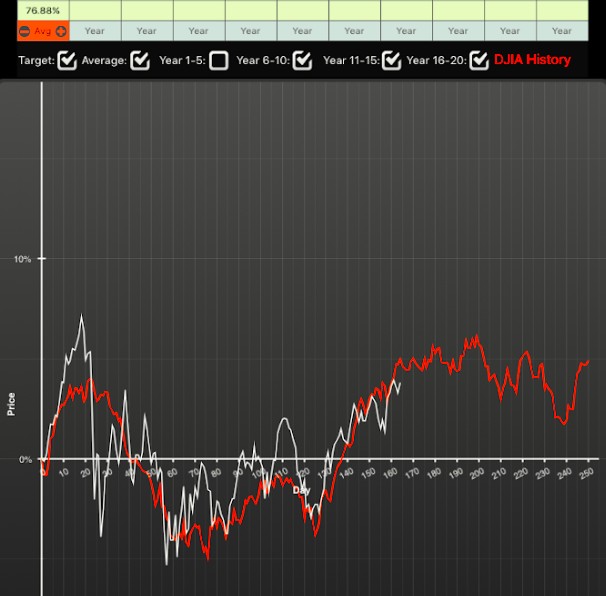
(Chart courtesy of OT Seasonal )
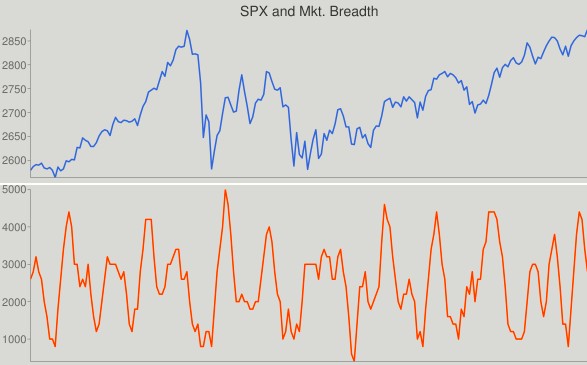
As mentioned last week, Market Breadth needed a few days before getting overbought again. This happened exactly on schedule, and the fact that the market is advancing while Market Breadth is retreating from overbought levels is another bullish sign:
Here are the monthly CIT pivots for SPX.
Pivot: 2825, S1 – 2787, S2 – 2750; R1 – 2862, R2 – 2900
The projected trading range for next week for SPX is 2830-2893.
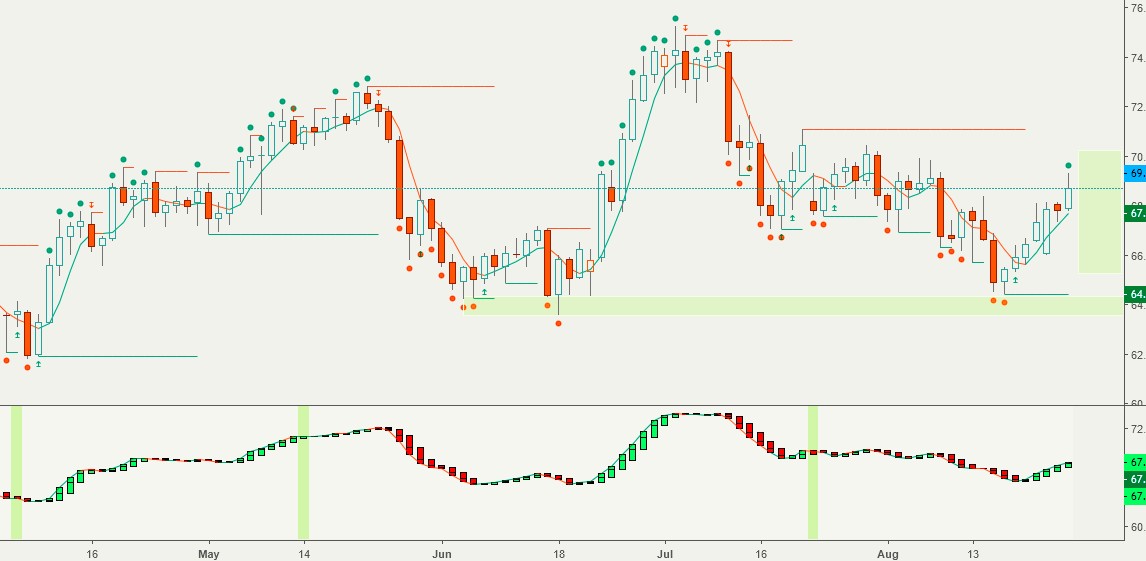
Oil reached the projected high target and remained on a buy signal. Failure to make a new high early next week is likely to trigger a sell signal.
The projected trading range for oil for next week is 65.25 – 70.25.
Monthly pivots: P - 68.4, S1 - 65.9, S2 – 63.6, R1 – 71, R2 - 73
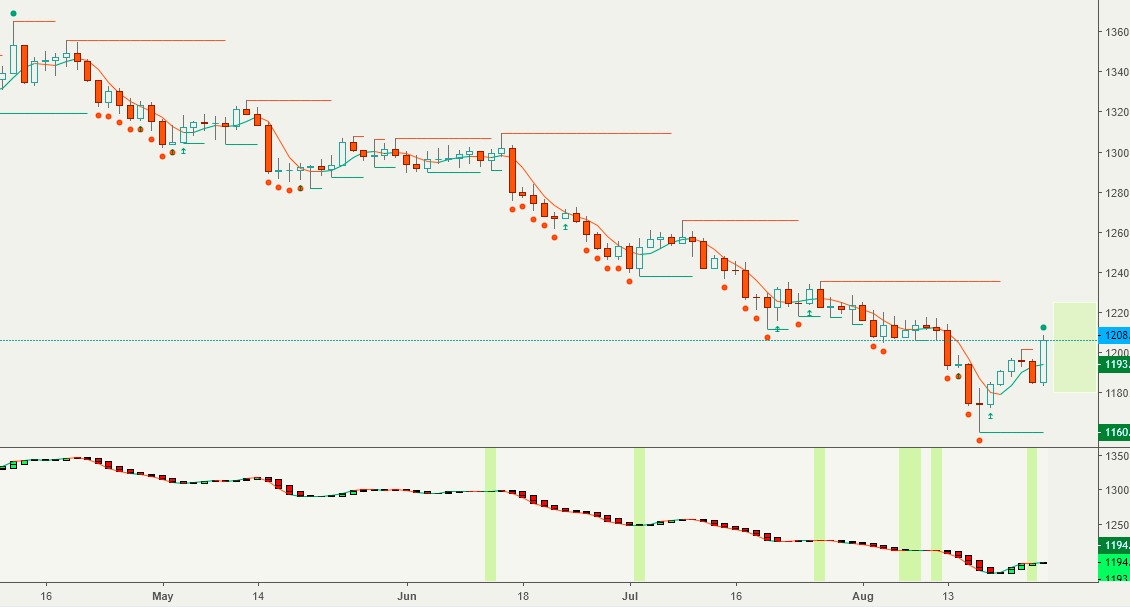
While the long-term trend for gold is down, the counter-trend buy signal initiated at the end of last week remained in place.
The last time gold had a 16 week long uninterrupted downswing was in 1997. Gold then had an 8% bounce before the downtrend resumed.
Monthly pivots: P - 1224, S1 - 1200, S2 – 1177, R1 – 1250, R2 - 1270
The projected trading range for gold for next week is 1180 - 1220:
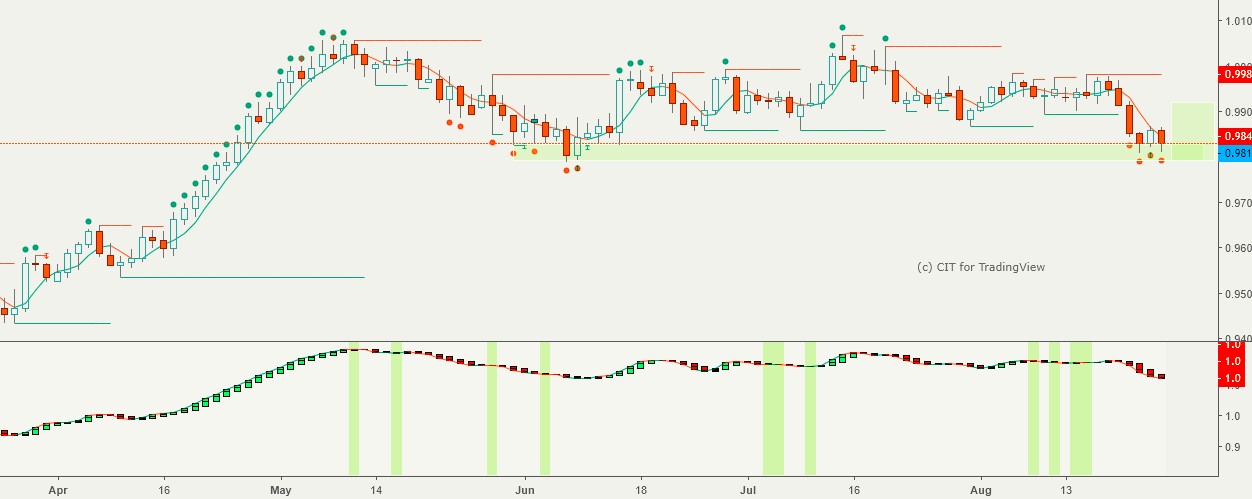
All G6 pairs hit their projected targets, but special mention goes to USDCHF which broke out of a narrow three month trading range to hit our downside projection.
The projected trading range for USDCHF for next week is 0.98 – 0.992
0.98 happens to be the 50% retracement of the April – May ’18 bull run, while 0.992 coincides with the monthly pivot for USDCHF:
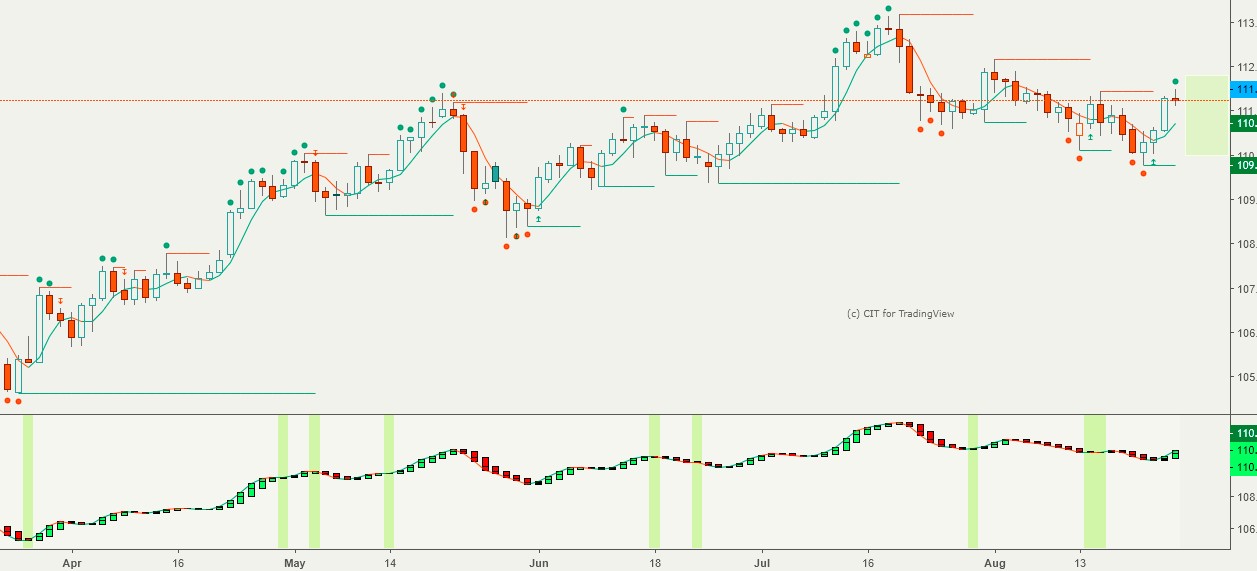
USDJPY reversed course at the beginning of the week and reached our upside target.
The projected trading range for USDJPY for next week is 110 – 111.8:
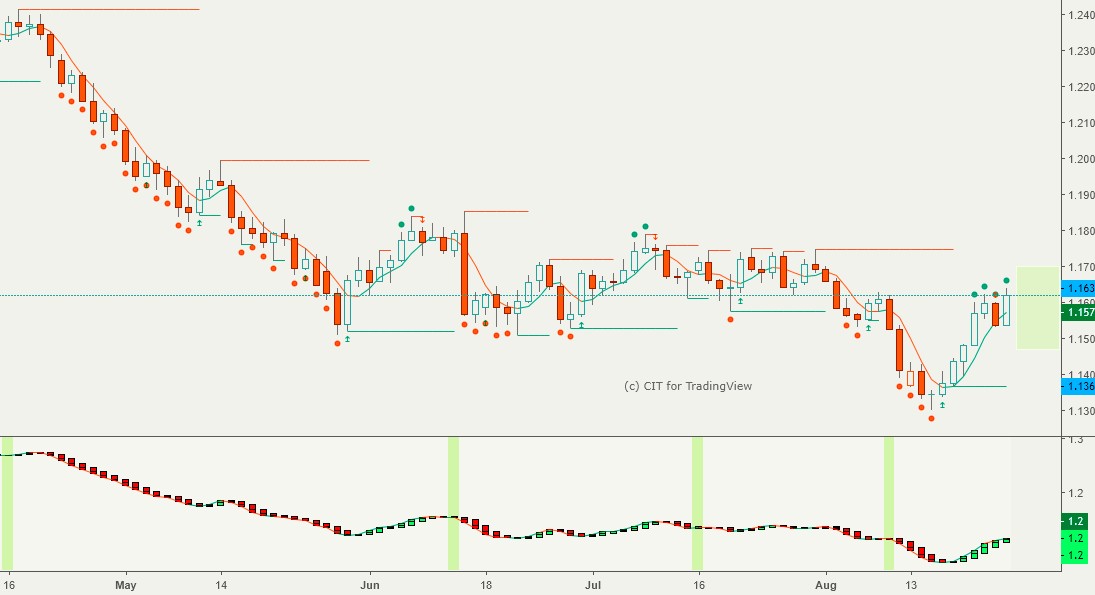
EURUSD remained on a buy signal all week long and easily broke above our upside target. Nevertheless, the long-term trend remains down, and current action should be viewed as an oversold, counter-trend rally.
The projected trading range for EURUSD for next week is 1.147 – 1.17:
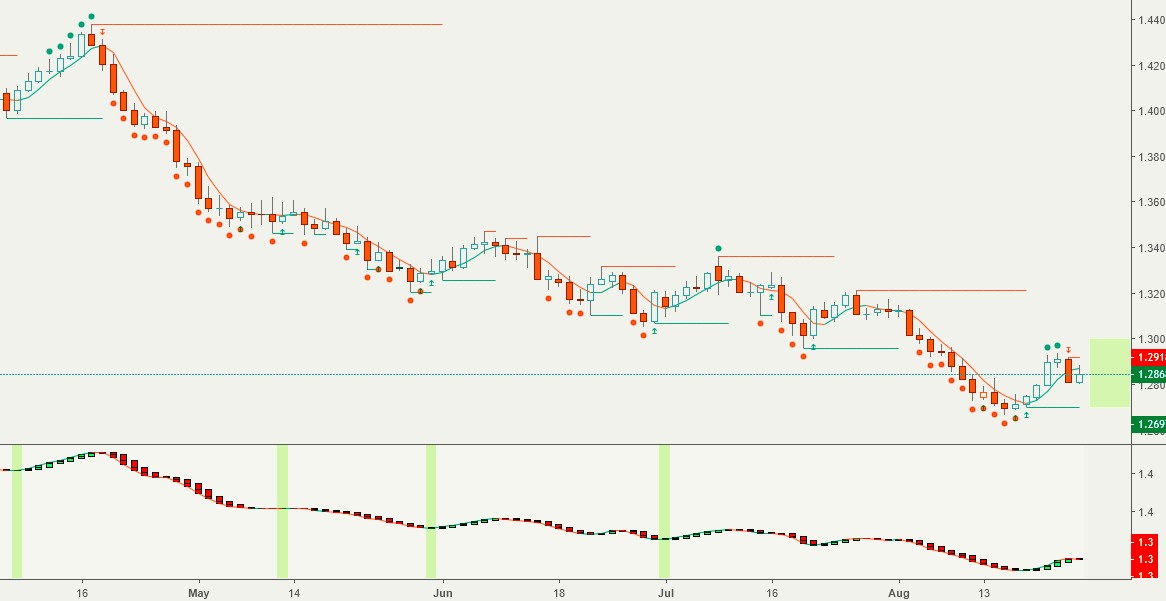
GBPUSD reached our upside target and reversed. As noted before, the long-term trend is down, suggesting that rallies should be sold. The pivot line is at 1.2866.
The projected trading range for GBPUSD for next week is 1.27 – 1.3:
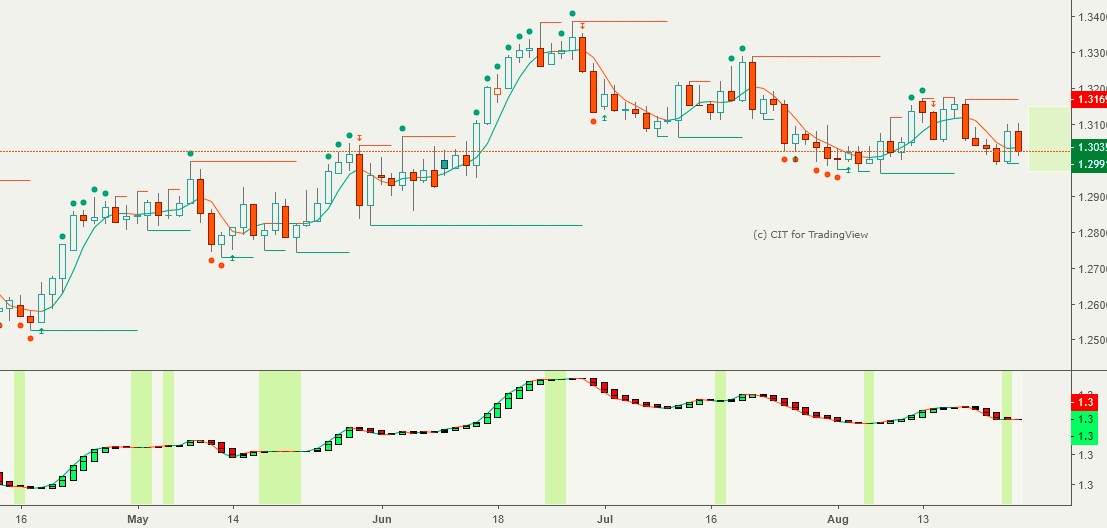
USDCAD reversed from our downside target and remains range-bound.
The projected trading range for USDCAD for next week is 1.297 – 1.315:
AUDUSD reached our upside target and staged a sharp reversal.
The projected trading range for AUDUSD for next week is 0.722 – 0.737:

Charts, signals and data courtesy of OddsTrader, CIT for TradingView and NinjaTrader 8
Disclaimer:Futures and forex trading contains substantial risk and is not for every investor. An investor could potentially lose all or more than the initial investment. Risk capital is money that ...
more

