
SPX Drops Below Major Support As 10-Yr Yields Tags 3%
I last wrote about the S&P 500 Index on April 19 and also included a couple of updates later that day.
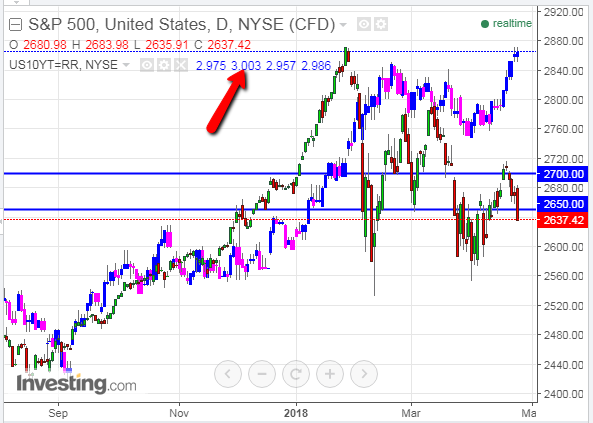
I mentioned that its latest rally that tagged 2700 was weak and that the intraday action that day was hinting that it could be a pivot point where we'd see price either spike back up to 2700 or plunge down to 2650, or lower.
As at 1:30 pm ET today (Tuesday) the SPX has plunged below 2650 as the 10-Yr Treasury Yields tagged 3%, as shown on the following daily chart.
(Click on image to enlarge)
Furthermore, the SPX:VIX ratio has also broken below the Bull/Bear Line-in-the-Sand level of 150.00, as shown on the daily ratio chart below. Price is sitting just above the 50-day MA.
The RSI has dropped below 50.00. If the MACD and PMO cross over to the downside, and the RSIremains below 50.00, this would form a new "SELL" signal and indicate further weakness ahead for the SPX.
(Click on image to enlarge)


