
Spreads And Recession Watch
Since we’re talking recession, it’s of interest to see what market indicators are saying, for the US and for the world. First, the term spread for the US:
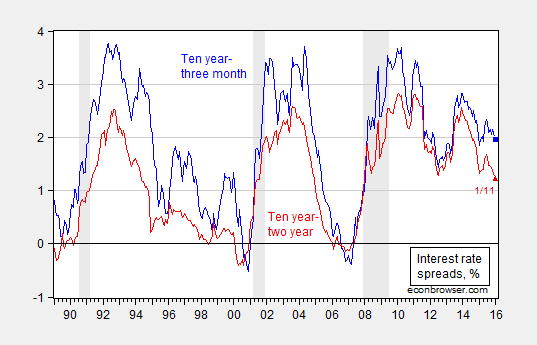
Figure 1: Ten year-three month spread (blue), and ten year-two year spread (red). January observation is for 1/11. NBER defined recession dates shaded gray.
Source: Federal Reserve Board via FRED, NBER, and author’s calculations.
The inversion of the yield curve which typically precedes a recession (at least over the post-War era) has not appeared. We can assess the likelihood more formally.
Using the probit regression estimate (equation 3, Table 5) in Chinn-Kucko (2015), one can obtain an estimate of the probability of a recession in the next twelve months.
Prob(Recession=1) = -0.27 -0.69 × spread
Pseudo-R2 = 0.38, NObs = 519, Sample = 1970-2013.
Using the spread value of 1.96 ppts for January 11, the implied probability of recession is 5%.
Some discussion has focused on credit spreads. The Moody’s BAA-Treasury spread and TED spread (for measuring liquidity) is shown in Figure 2.
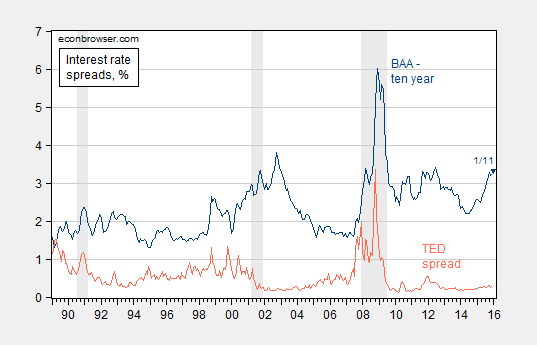
Figure 2: Moody’s BAA corporate bond-ten year Treasury spread (dark blue), and LIBOR-3 month Treasury (TED) spread (orange). January observation is for 1/11. NBER defined recession dates shaded gray.
Source: Federal Reserve Board via FRED, NBER, and author’s calculations.
While the BAA-Treasury credit spread is elevated, especially relative to the 1990’s and 2000’s, the spread has been trending upward over time (2.7 bps/year from 1953-2007). In any case, credit spreads are typically considered contemporaneous, rather than leading, indicators of recession.
Finally, what about term spreads around the globe?
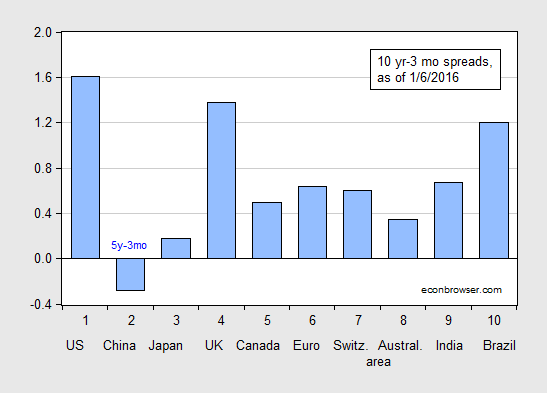
Figure 3: Ten year-three month term spreads, as of 1/6/2016 (blue bar). China observation is Five year-three month term spread. Euro ten year rate is for Germany.
Source:Economist January 9th edition, and author’s calculations.
While the predictive power of the term spread is less studied for several of the countries examined, it’s interesting that back in April 2015, several yield curves were near inversion.
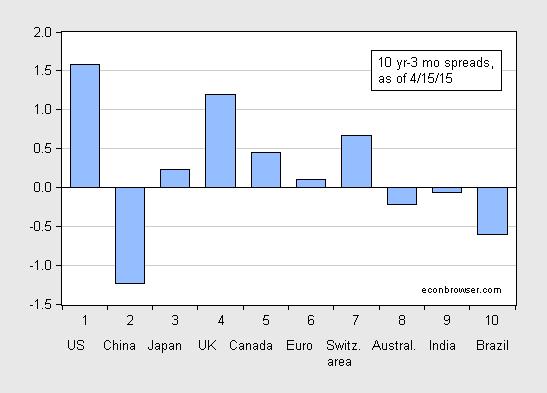
Figure 4: Ten year-three month term spreads, as of 4/15/2015 (blue bar). China observation is Five year-three month term spread. Euro ten year rate is for Germany.
Source:Economist April 18th edition, and author’s calculations.
Brazil and Switzerland (which has a positive term spread) are as of latest reported GDP figures experiencing negative growth, while Australia and India appears to have dodged recession thus far. Further note that the yield curve in China was inverted in April, as it is now; but I still am not aware of any literature linking Chinese yield curve inversions to recessions.
Disclosure: None.


