
Spectacular Bull Market
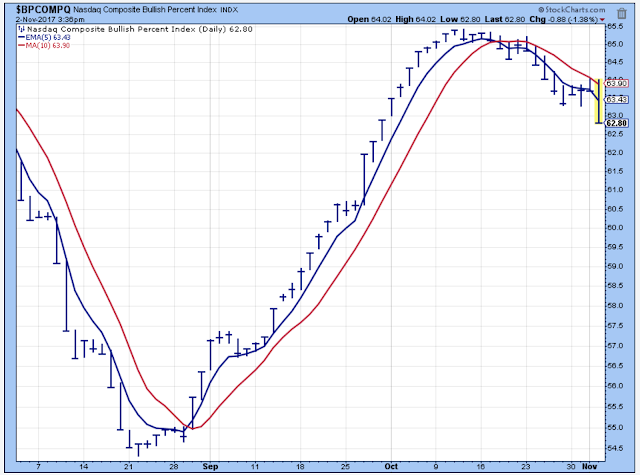
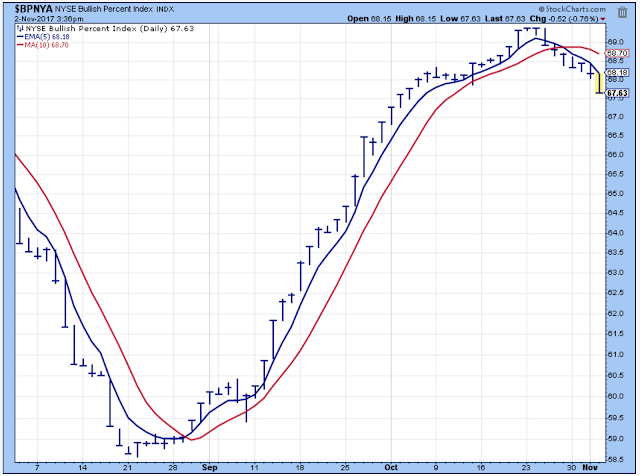
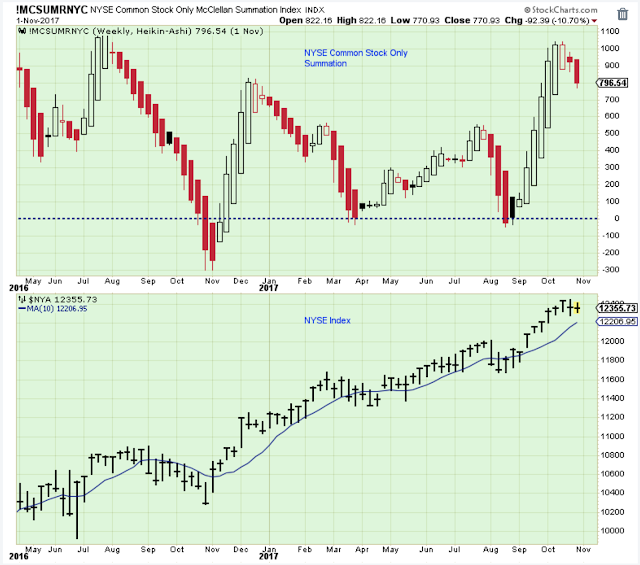
I have two fairly convincing charts below that continue to confirm the short-term downtrend.
(Click on image to enlarge)
(Click on image to enlarge)
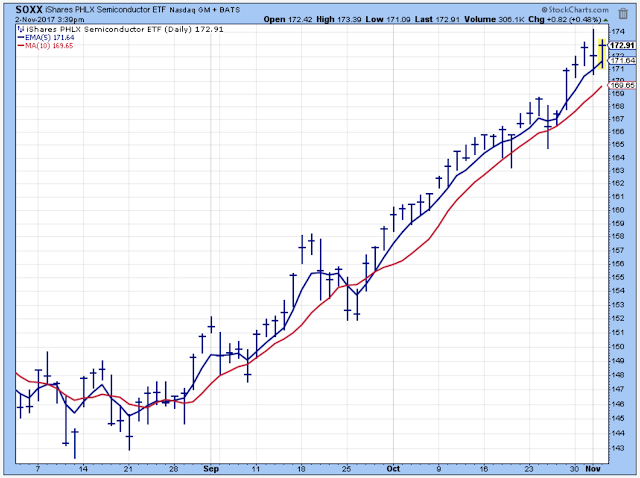
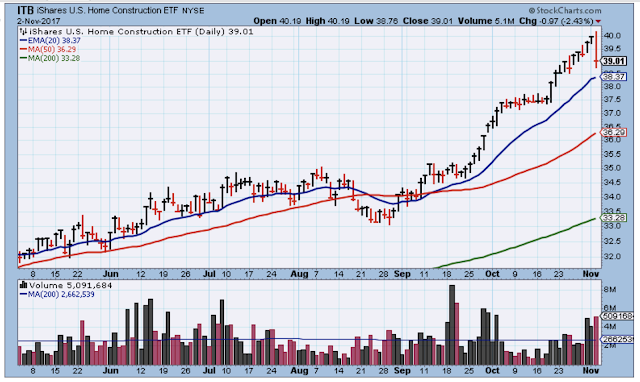
Then again, if you are in the right area of the market, it doesn't matter what the indicators say. Is it too late to buy this group? I honestly don't know.
(Click on image to enlarge)
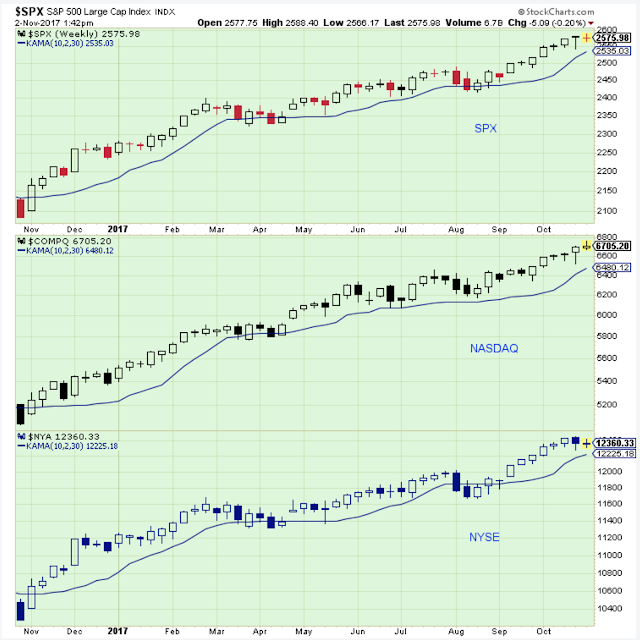
The Medium-Term Trend
This has been a spectacular bull market as the chart below shows. The medium-term cycles within the bull market are shown by the dips such as Jun-2016, Nov-2016, Apr-2017, Aug-2017.Sometimes the cycle bottoms are hard to see such as April of this year.
(Click on image to enlarge)

Sometimes you have to look at differents views of the market to see the cycle bottoms. This chart shows the Apr-2017 cycle low more clearly.
(Click on image to enlarge)
I mention this because there are periods of time when the market seems so strong that we (me) forget about the cycles within the larger cycle, and it is my belief (or maybe it is my fear) that when we forget about the cycles we are the most vulnerable to suffer losses.
So, I am including the chart below as a reminder to you and to myself that the medium-term trend looks like it may be peaking, and we could be on the downside of the latest cycle. But, I emphasize "could be" because who really knows.
(Click on image to enlarge)
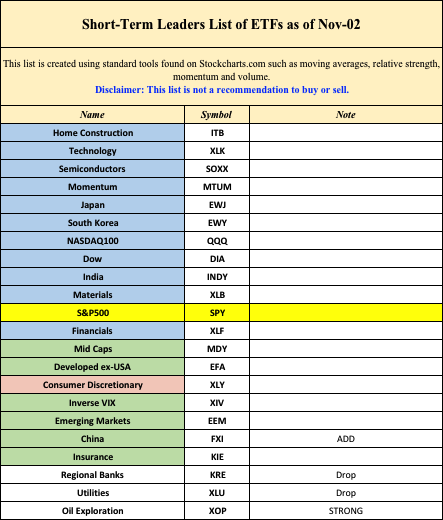
The Short-Term Leader List
The strongest ETFs are blue, the additional leaders are green and the weakest are red. The S&P500 is the benchmark. Disclaimer: This list is not a recommendation to buy or sell.
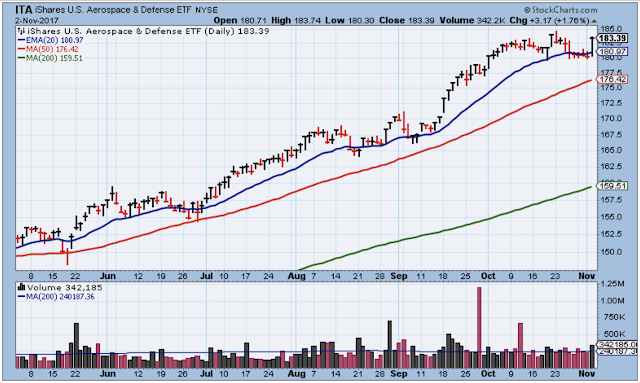
The market looked tired today, and this ETF is a good example. It is such a steady run higher and then some serious selling. I am sure Fed announcements yesterday and today are an influence in this selling, but considering the run higher, it was probably going to sell off regardless.
(Click on image to enlarge)
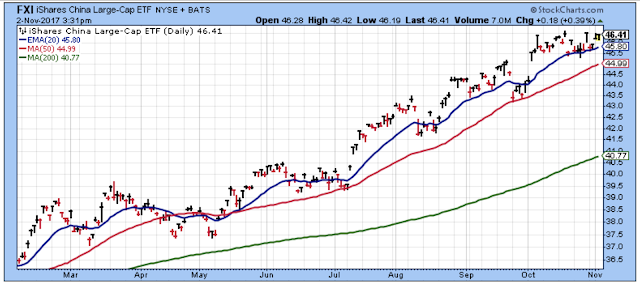
The China ETF is below. Is it going to break out? Or is it ready to roll over?
(Click on image to enlarge)
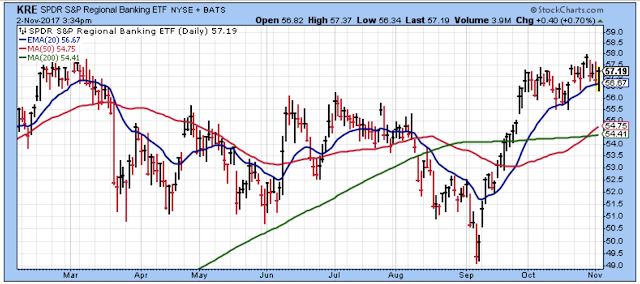
What an ugly looking chart for the Regional Banks.
(Click on image to enlarge)
Some nice looking strength here in this ETF.
(Click on image to enlarge)
Outlook
The ECRI index has bottomed out and is pointing higher.
The long-term outlook is improving.
The medium-term trend is up. The best period for buying is past.
The short-term trend is down.
Disclaimer: I am not a registered investment advisor. My comments above reflect my view of the market, and what I am doing with my accounts. The analysis is not a recommendation to buy, ...
more

