
S&P 500 Snapshot: Post-Fed Hike And FCC Ruling, Tax Bill Looms
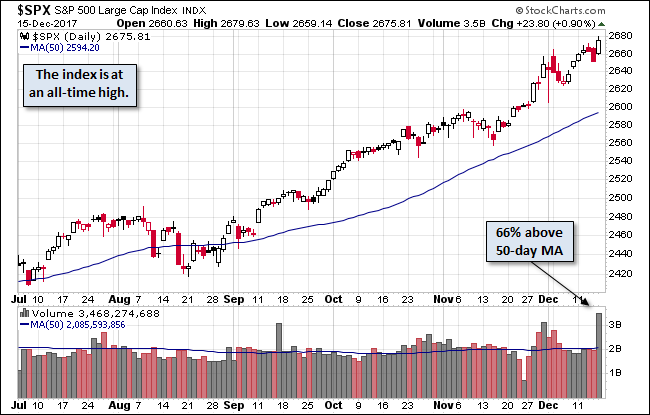
This week was a busy one for headlines, between the FCC's decision to repeal net neutrality rules, the Fed's expected rate hike, and the tax bill on the verge of passing. The S&P 500 jumped upon opening Friday, and climbed throughout the day, closing 0.9% above Thursday. The preliminary volume tally shows a whopping 66% above the 50-day moving-average. Year-to-date, the index is up 19.52%.
(Click on image to enlarge)

The U.S. Treasury puts the closing yield on the 10-year note at 2.35%.
Here is a daily chart of the S&P 500. Today's selling puts the volume 66% above its 50-day moving average.
(Click on image to enlarge)
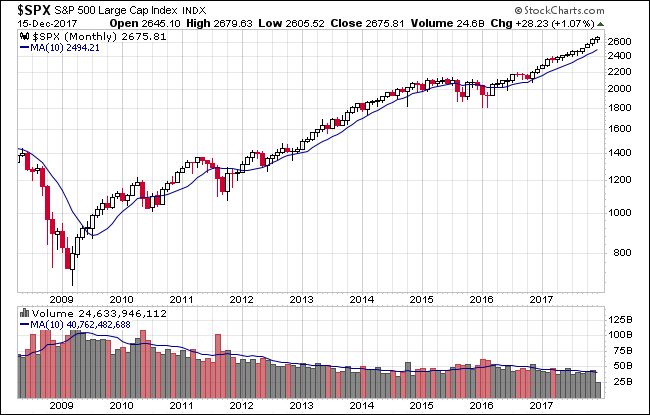
Here's a monthly snapshot of the index going back to December 2008.
A Perspective on Drawdowns
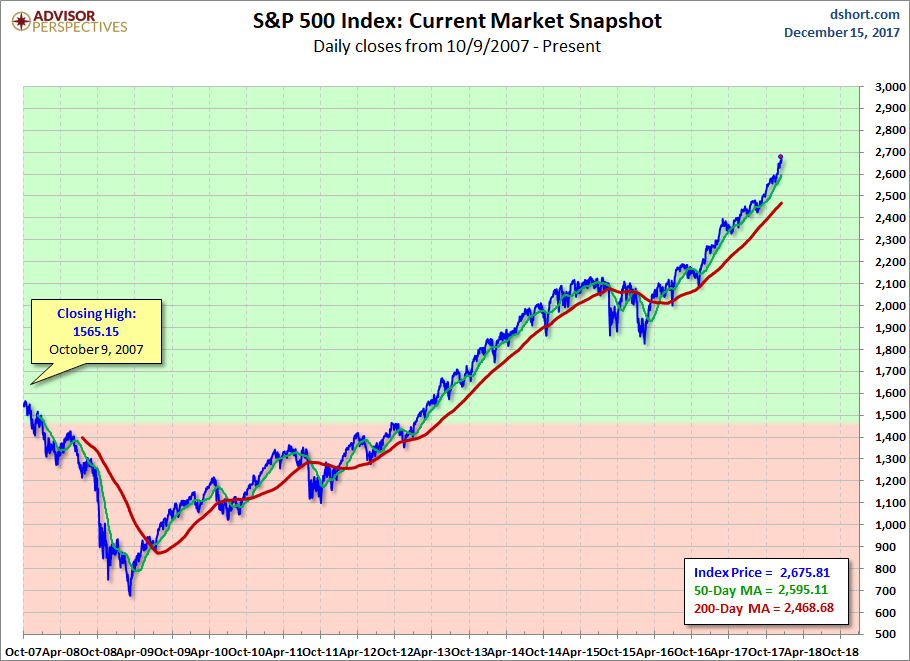
Here's a snapshot of record highs and selloffs since the 2009 trough.
(Click on image to enlarge)

Here is a more conventional log-scale chart with drawdowns highlighted.
(Click on image to enlarge)

Here is a linear scale version of the same chart with the 50- and 200-day moving averages.
(Click on image to enlarge)
A Perspective on Volatility
For a sense of the correlation between the closing price and intraday volatility, the chart below overlays the S&P 500 since 2007 with the intraday price range. We've also included a 20-day moving average to help identify trends in volatility.
(Click on image to enlarge)

Disclosure: None.


