
S&P 500 Snapshot: A Gain Of About Half Of The Rate-Hike Selloff
Yesterday the S&P 500 fell 0.81% in the wake of the 2 PM news of a Fed rate hike. Today the index rallied to its late-morning 0.84% intraday high, erasing yesterday's selloff. But the level didn't hold. The index closed the session with a substantially trimmed 0.39%, which reclaimed about half of the rate-hike loss.
Here is a snapshot of the past five sessions.
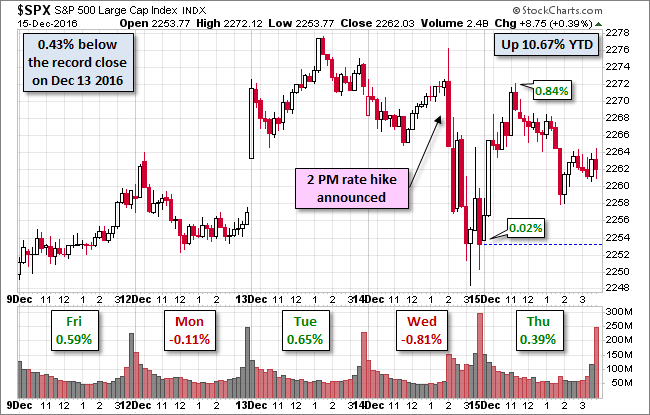
The yield on the 10-year note closing at 2.60%, up six BPs from its previous close and the highest closing yield since September 18, 2014.
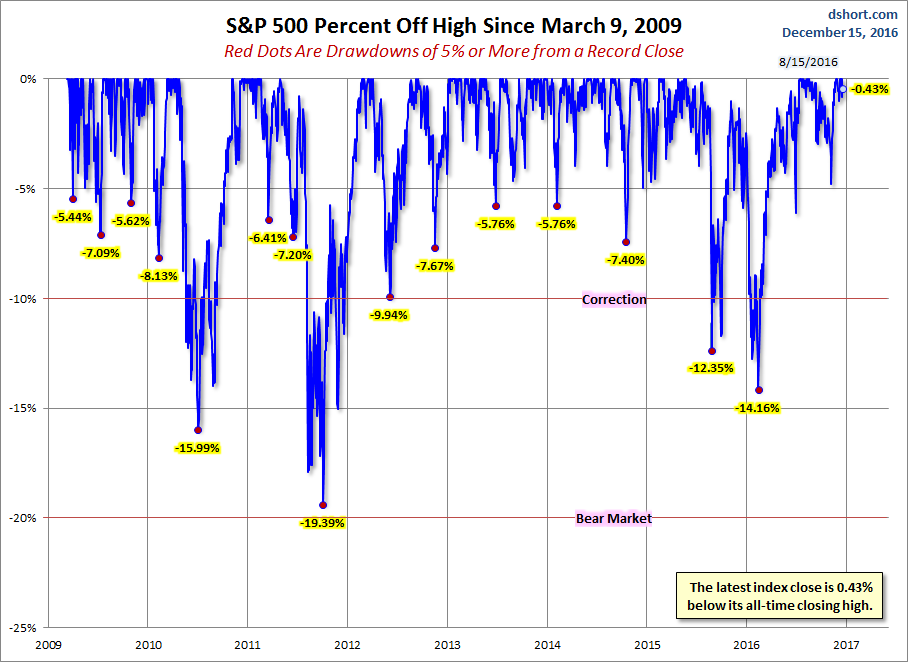
A Perspective on Drawdowns
Here's a snapshot of selloffs since the 2009 trough.
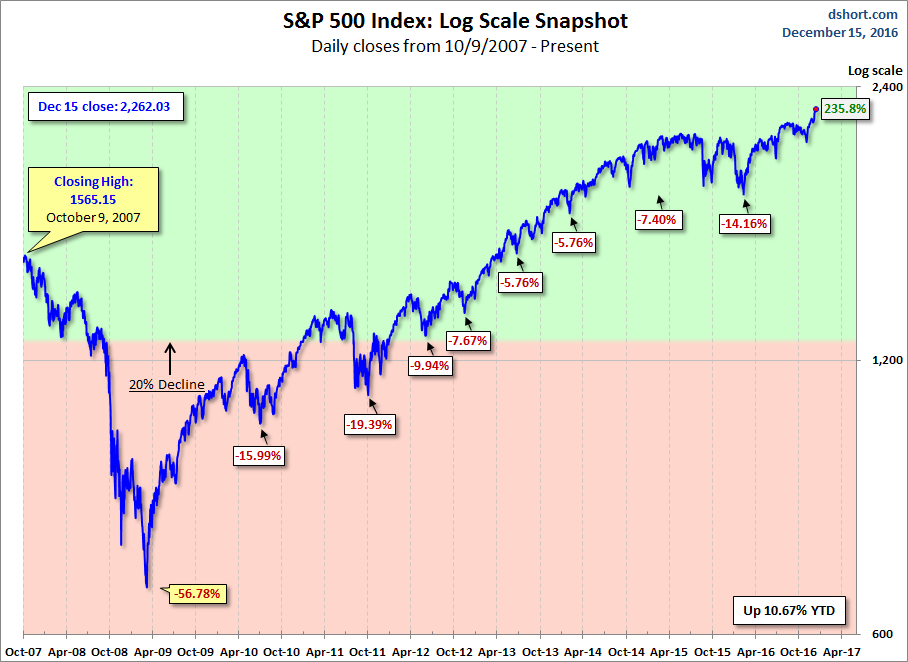
Here is a more conventional log-scale chart with drawdowns highlighted.
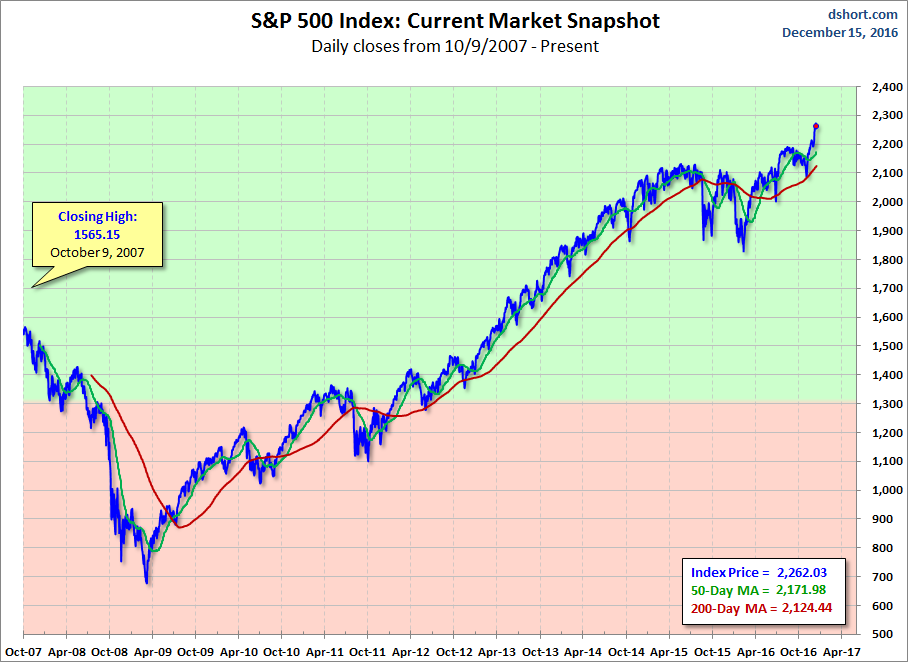
Here is a linear scale version of the same chart with the 50- and 200-day moving averages.
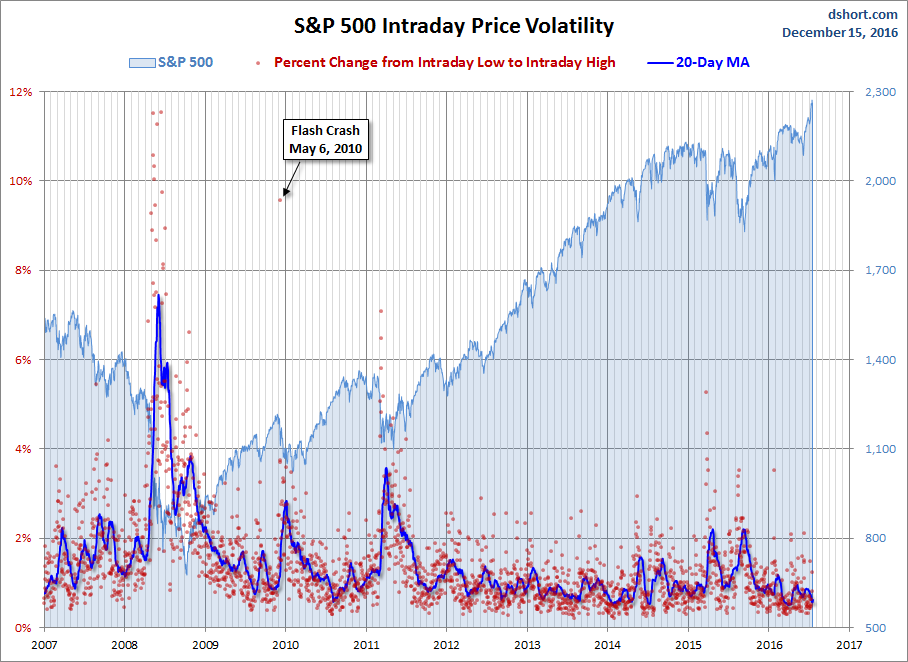
A Perspective on Volatility
For a sense of the correlation between the closing price and intraday volatility, the chart below overlays the S&P 500 since 2007 with the intraday price range. We've also included a 20-day moving average to help identify trends in volatility.
Disclosure: None.


I know everyone is expecting an imminent pullback, but it looks like an inverted head and shoulders forming. It would not surprise me to see this market grind up even higher as people desperately wait for a substantial pullback--thinking it's coming any day now.
Thanks for sharing