
S&P 500 In Lévy Flight In Week 1 Of January 2018
In the first week of 2018, investors would appear to be shifting their forward-looking horizons to the more distant future, from the current quarter of 2018-Q1 toward, we believe, the more distant future quarter of 2018-Q3.
(Click on image to enlarge)
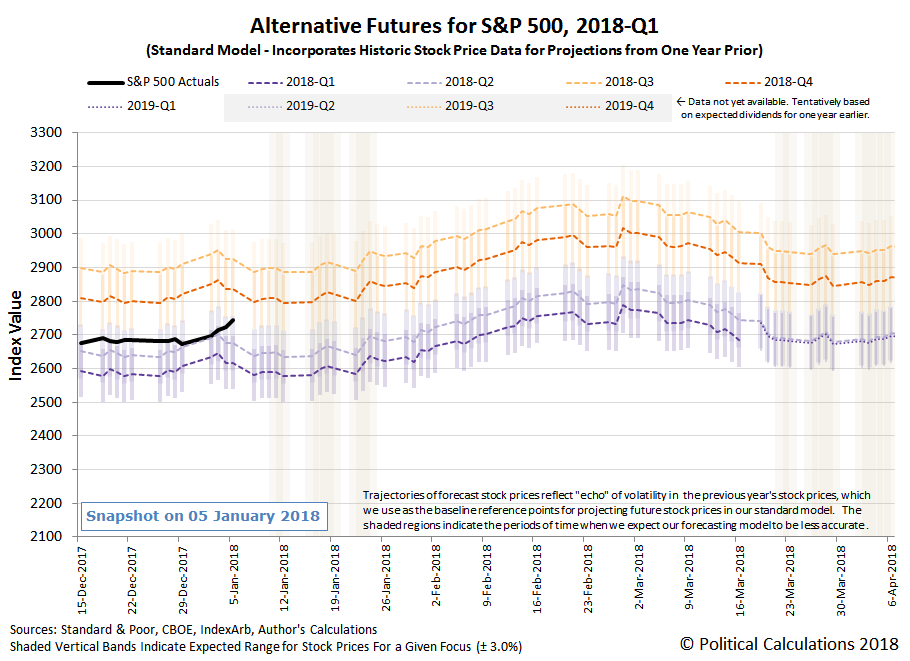
Through the end of Week 1 of 2018, we would say that investors are focusing about 60% of their attention on 2018-Q1 (down from 80% at the end of 2017) and 40% on 2018-Q3. This shift in forward-looking focus corresponds to a 2.6% gain (69.54 points, from 2,673.61 to 2,743.15 for the S&P 500) during a comparatively short period of time, and the largest upward movement over a period of five trading days going back more than a year.
Which is to say that sort of large magnitude upward change in the S&P 500 doesn't happen very often. More often than not, stock prices tend to move by much smaller amounts over such short periods of time, where even a large, sustained 657.97 point (31.6%) rally of the kind we've seen since 8 November 2016 doesn't produce the kind of sudden upward shifts that we're seeing now.
In math, this kind movement is called a Lévy flight, which is similar to a random walk, but with one big difference. Instead of having the sizes of all the movements be relatively small and similar in size to one another, the size of some of the movements are disproportionately large compared to most of the others. More so than would be predicted by a normal distribution.
When that happens with stock market, what you're really seeing is one of the quantum-like properties of how stock prices work, where we see these kinds of outsized movements whenever investors are shifting their attention from one point of time in the future to another, where the difference in expectations for dividends associated with the different points of time is large enough to produce outsize movements, which we've previously described as a "quantum random walks" (if you only have time to follow only one link in this article, click this one!)
They're pretty cool when they happen, and as it turns out for this week, timely, because the science of economics is believed by some to be long overdue for a quantum revolution, where perhaps seeing a quantum event like this might motivate some forward movement within the field.
Analyst's Notes
We're coming up on a relatively short period where the accuracy of our standard dividend futures-based forecast model for the S&P 500 would be reduced because of the echo effect from the past volatility of stock prices, which arises because the use of historic stock prices in making its projections. Although we've had some success in adapting a simple technique to get around that limitation, we're going to skip making a red-zone forecast to cover this period for the following reasons:
- The upcoming period where the echo effect is present is short - we anticipate it running from 11 January to 24 January 2018.
- The magnitude of the echo is comparatively low. While the accuracy of our model's projections will be affected, we don't anticipate, in the absence of noise, that the difference between the model's projected ranges and actual trajectories for the S&P 500 will be all that great.
- These first two items would apply even if stock prices were not currently in Lévy flight. Being in Lévy flight adds a new dynamic, where we would not anticipate that a red-zone "connect the dots" forecast would work, at least yet, for the following reasons:
- We have not reached a point where the expectations for a quarter-point rate hike by the Fed in March 2018 have locked in. As of Friday, 5 January 2018, the CME Group's Fedwatch tool indicates a 67% probability of such a hike being announced on 21 March 2018, with nearly a 32% chance that they'll keep their target range steady at 125-150 basis points. Until the expectation for a 2018-Q1 rate hike locks in, we believe that investors will keep at least a portion of their forward-looking focus on the current quarter of 2018-Q1, which means that the actual trajectory of stock prices will fall somewhere in between the indicated trajectories for 2018-Q1 and 2018-Q3. 2018-Q3 coincides with what investors currently expect will be the timing of the Fed's next action for short-term U.S. interest rates.
- As of Friday, 5 January 2018, stock prices were actively in a Lévy flight transition from one "quantum" level for our alternative future projected trajectories to another, where we don't know yet to what extent investors will come to balance their forward-looking focus between 2018-Q1 and 2018-Q3. Until that split-in-focus between future points in time might stabilize, we would not be confident in setting a "parallel" red-zone forecast.
And of course, that's all assuming that investors don't have reason to shift their attention to some other point of time in the future, which would be driven by learning new information and changes in future expectations. Speaking of which, here are some of the more significant news headlines that we believe would have strongly influenced investor expectations of the future during Week 1 of January 2018.
Tuesday, 2 January 2018
- Oil prices close to mid-2015 highs, but doubts over further rises loom
- S&P, Nasdaq hit record closing highs in new year; dollar drops
- Wall Street starts year on strong note; Nasdaq ends above 7,000
Wednesday, 3 January 2018
- Fed policymakers see future rate rises guided by inflation, fiscal stimulus
- Following the release of the Fed's December meeting minutes, the CME Group's FedWatch tool showed a 67.5% probability of a quarter-point hike in March 2018 (up from 56% at the end of 2017), and a greater than 50% chance of a second quarter point rate hike as early as August 2018.
- Oil at highest in two-and-a-half years on Iran tensions, strong demand
- S&P 500 tops 2,700 on tech advance; Dow, Nasdaq hit records
Thursday, 4 January 2018
- Oil at highest since 2015 on inventory drawdown, Iran unrest
- Dow tops 25,000 milestone; Wall St extends New Year's rally
- St. Louis Fed's Bullard links tax bill with equity surge, stronger growth outlook
Friday, 5 January 2018
- U.S. trade deficit rises to near six-year high on record imports - Translation: domestic U.S. producers can't keep up with increased demand from strengthening economy!
- Oil retreats on U.S. output rise after hitting near 2-year high
- Traders keep bets on two Fed rate hikes after jobs report
- Big news if it happens (and alert Scott Sumner!): In test for Powell, internal groundswell grows to rethink Fed's inflation approach
- S&P 500, Nasdaq post best week in more than a year
Elsewhere, Barry Ritholtz took note of the positives and negatives for the U.S. economy and markets in the first week of January 2018.
Disclaimer: Materials that are published by Political Calculations can provide visitors with free information and insights regarding the incentives created by the laws and policies described. ...
more

