S&P 500 Grasps For Support As Treasury Yields, US Dollar Continue To Gain
A CHANGE-OF-PACE IN THE EQUITY SPACE
As we approach the US open, the S&P 500 is sitting just a few handles off of yesterday’s low. Yesterday’s session was not pretty, with selling starting at the open and running all the way into the early afternoon. A bounce began to show at around 2PM, and by the 4PM close prices had rallied by as much as 20 handles off of the lows; but those gains could not hold, and S&P futures have been on offer since shortly after this morning’s Asia open.
The big question is whether we’re going to see a deeper pullback after the selling that started to show in February. Coming into 2018, US equities were holding on to gains that had been showing in a fairly consistent manner since the US Presidential Election in 2016. That theme hit fever pitch in January, as excitement around tax cuts took over and helped to drive the S&P to a fresh all-time-high.
But February brought a far different environment. Selling in the early-portion of the month brought an approximate 40% retracement of the post-Election trend, and after a bit of support cauterized in the middle of the month, prices have been in a range of congestion since.
S&P 500 DAILY CHART: CONTINUED CONGESTION SINCE FEBRUARY
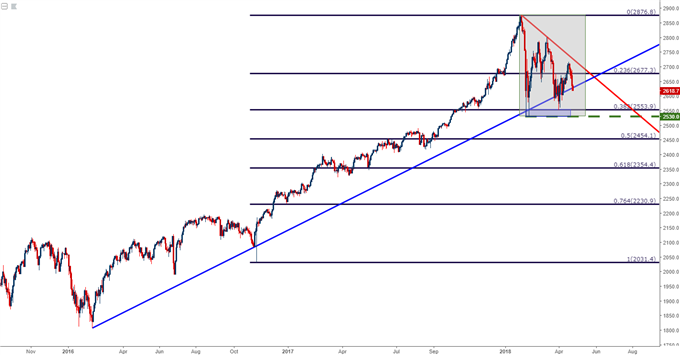
INCREASING VOLATILITY NOT A POSITIVE SIGN FOR BULLISH CONTINUATION
As we discussed coming into Q2, the pickup in volatility that was seen in Q1 could be an initial sign of a top being in-place. Rarely do we see a strong bullish trend just flip the switch and become a strong bearish trend, as there is usually a bit of transition in-between.
The big point of difference here from prior runs of risk aversion, such as was seen in the summer of 2015, is the fact that the Fed has pretty much already played their hand. The bank wants higher rates, and with inflation jumping in the US after the Dollar’s dismal 2017, there may not be many choices that do not include higher rates at the bank. In the summer of 2015, as volatility swelled, the Fed simply kicked-back the expectation for the rate hike in September. The hike eventually came in December, and just a couple of weeks later, stocks keeled over again as we opened into 2016.
That risk aversion lasted for about six weeks. This was when Chair Yellen spoke in front of Congress at the Fed’s twice-annual Humphrey Hawkins testimony. Chair Yellen was able to pacify markets during this two-day testimony, and US stocks continued to run higher as we moved towards the Presidential Election later in the year. And after the election, it was basically a straight bee-line higher into this January’s high.
The point of bringing all of this up is the fact that we may not have such a friendly response from the Fed should another more intense bout of risk aversion show. Inflation came-in at 2.4% in the month of March in the US, well-above the bank’s 2% target; and we have a new Fed Chair in town that may not be so responsive to sell-offs in stocks; at least to the degree of his predecessors who were fully-entrenched in the rationale behind the ‘wealth effect’.
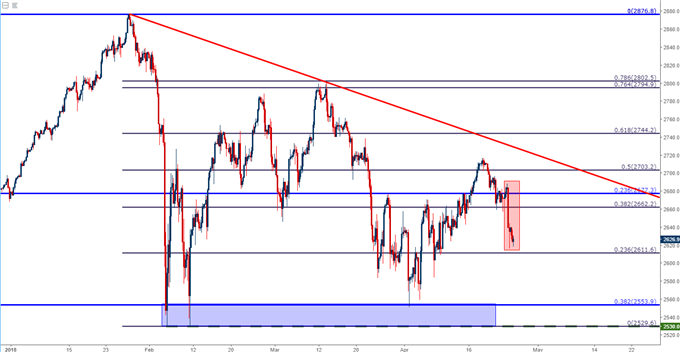
As we near this morning’s US equity open, the S&P 500 remains near the 23.6% Fibonacci retracement of the February sell-off at 2611. A bit lower at 2553.9, we have the 38.2% retracement of the post-Election move and just below that, at 2530, we have the February double-bottom. If that double-bottom gets taken-out, look out below. Until then, we have congestion, and the possibility of bullish setups on re-tests of support.
S&P 500 FOUR-HOUR CHART
US DOLLAR TO FRESH THREE-MONTH HIGHS
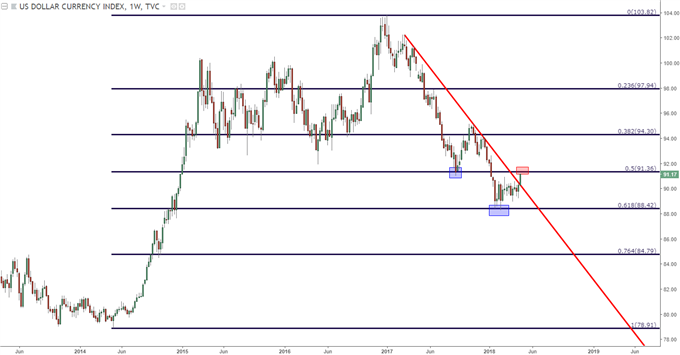
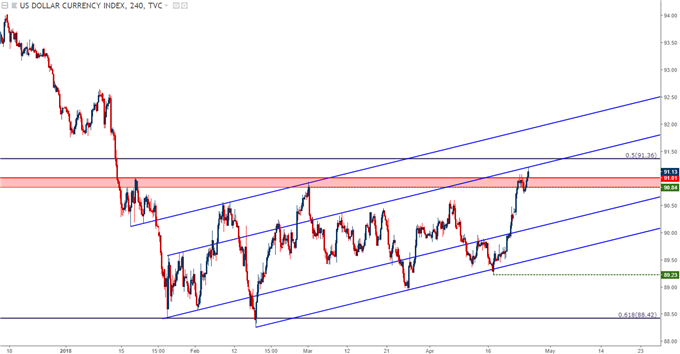
US Dollar strength continues to show, and the resistance that we looked at yesterday off of the 2017 low is in the process of getting taken-out. Prices are now fast approaching 91.36, which is the 50% retracement of the 2014-2017 major move in DXY; and the 61.8% Fibonacci retracement of that same move helped to mark support in Q1 after a continuation of the brutal trend that showed in 2017.
US DOLLAR VIA ‘DXY’ WEEKLY CHART: Q1 SUPPORT AT 61.8% HOLDS THE LOWS
On a shorter-term basis, we can see where that persistent response from bulls so far this week only allowed for a shallow pullback after yesterday’s resistance came into play. This keeps the door open for bullish continuation in the Greenback, and we looked at a variety of setups to work with that theme in yesterday’s webinar.
US DOLLAR VIA ‘DXY’ FOUR-HOUR CHART: STRETCH TO FRESH THREE-MONTH HIGHS
EUR/USD RESISTS AT PRIOR SUPPORT, CRAWLS TO SEVEN-WEEK LOWS
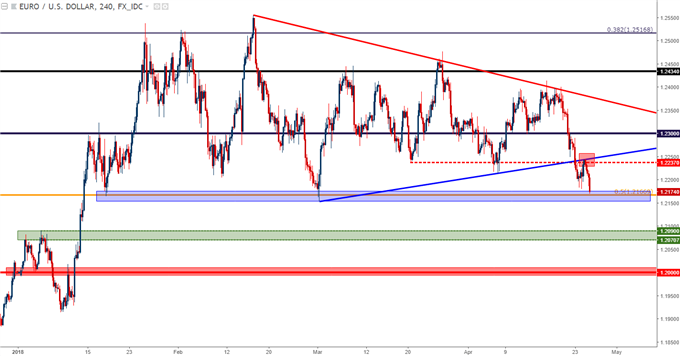
We looked at an area of confluent resistance yesterday taken from a region that had previously been confluent support. This was taken from a bullish trend-line taken off of the March and April swing-lows, combined with a prior batch of support from early-April.
Prices are now approaching our next area of support at 1.2167, which is the 50% retracement of the 2014-2017 major move, and this is a level that helped to turn-around bearish advances in both January and again in March. If this can’t hold, a group of prior swing-highs from January is exposed around 1.2071-1.2090, and below that we have a potential support test of the 1.2000 psychological level.
EUR/USD FOUR-HOUR CHART: RESISTANCE AT PRIOR TREND-LINE SUPPORT
GBP/USD RESISTANCE AT 1.4000 AS CORRECTION CONTINUES
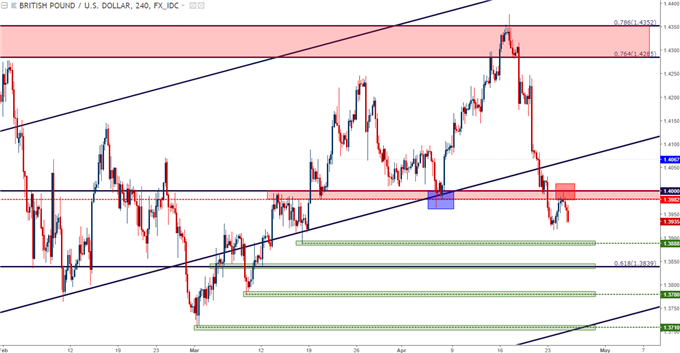
We have a similar setup in GBP/USD, and we looked at this yesterday with the prospect of a former area of support around 1.4000 becoming fresh resistance. This has played out so far, with the primary difference being that we have yet to break below yesterday’s swing-low. Nonetheless, this opens a series of interesting support levels underneath current price action.
GBP/USD FOUR-HOUR CHART: RESISTANCE AT PRIOR SUPPORT AROUND 1.4000 PSYCHOLOGICAL LEVEL
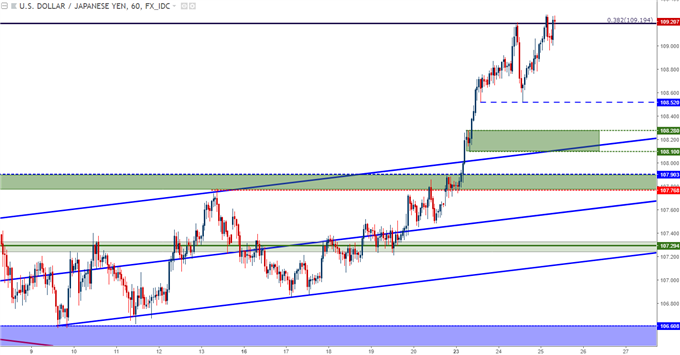
USD/JPY CONTINUES TO TEST KEY RESISTANCE
One area where the Dollar has not shown significant strength over the past 24 hours has been against the Japanese Yen. We looked at an area of Fibonacci resistance yesterday, and a day later we’re still seeing bulls battle at this level. That bullish response has been persistent thus far, and if we do see buyers able to edge out the offers, then we may have another trip up to 110.00 in the near-term.
USD/JPY WEEKLY CHART: BULLISH BREAKOUT RUNS INTO FIBONACCI RESISTANCE
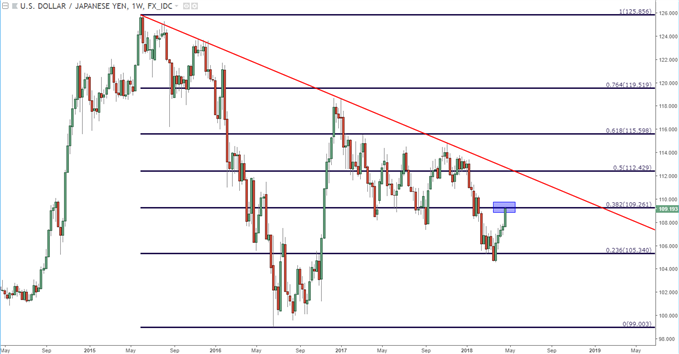
One benefit of prices resisting at that Fibonacci level yesterday was the fact that an area of higher-low support is now availed for bullish continuation strategies. This is around 108.50, which becomes the most recent ‘higher-low’ on the chart; and if we do see prices continuing to struggle to breakout today, a pullback in the move can use that area for stop placement.
USD/JPY HOURLY CHART: BULLS BATTLE AT FIBONACCI RESISTANCE
FOR USD-STRENGTH PLAYS, COMMODITY CURRENCIES REMAIN ATTRACTIVE
As USD-strength continues to show across FX markets, the point of attraction for that theme remains against commodity currencies such as USD/CAD, AUD/USD and NZD/USD. We looked at a short-side NZD/USD setup last week, and prices are making a fast-move lower towards the psychological level of .7000.
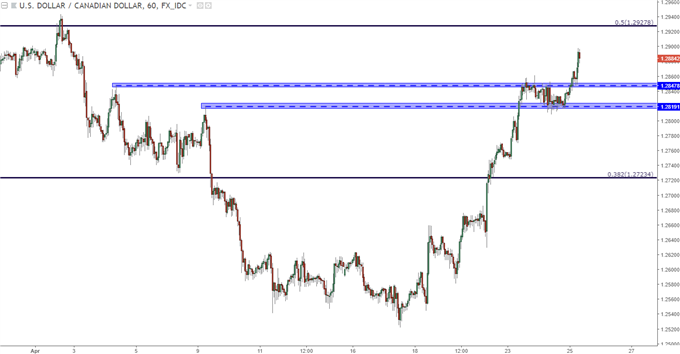
But also interesting there has been USD/CAD, which is up by more than 300 pips from last week’s low. The pair has put in another breakout this morning and is fast approaching the 1.2900-handle; but should a pullback show, there are two areas of interest that could be used to look for higher-low support in that bullish trend; around 1.2850 and 1.2820.
USD/CAD HOURLY CHART: BULLS TAKE OVER FROM LAST WEEK’S LOWS