
Some Weakness Creeping Into The Indicators
Good morning and welcome back to the land of blinking screens. After a whirlwind weekend of planes, trains, and automobiles in the Midwest – where we spent the majority of the time successfully dodging ice storms (still can’t believe the plan actually worked!) – I have returned to what can only be referred to as epic technical difficulties due to server migrations this morning. So, with time running short, I’m going to skip the pleasantries and get right to the weekly review of my important models and indicators. As you will recall, the goal of this exercise is to get a clear picture of what is happening underneath the surface of the market action.
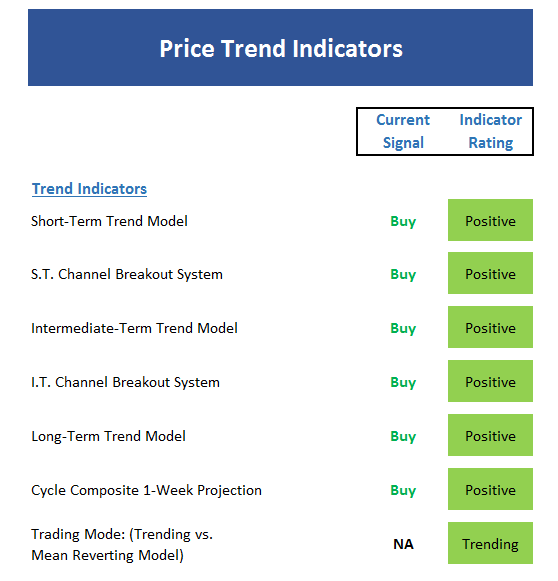
The State of the Trend
We start with a look at the “state of the trend” from our objective indicator panel. These indicators are designed to give us a feel for the overall health of the current short- and intermediate-term trend models.
Executive Summary:
- To be sure, there is an awful lot of green on the board here
- However, the state of the trend is not as positive as an initial scan might indicate
- While NASDAQ is dancing to new highs, the rest of the major indices are basically stuck in a trading range
- The short-term trend channel system is vulnerable at this point in time as the range is tightening considerably
- Our trading mode indicators are starting to weaken, but two out of three suggest stocks are trending (But subjectively, I have my doubts)
- The good news is the cycle composite is positive for the next few weeks
The State of Internal Momentum
Now we turn to the momentum indicators…

Executive Summary:
- The momentum board also sports a lot of green boxes this week
- But again, the readings tend to be on the lower end of positive and as such, the internals aren’t as strong as the board might indicate at first blush
- Good news: Our Industry Health model has nudged back up to a moderately positive reading
- The short-term volume indicator remains positive, but has been weakening
- The intermediate-term volume relationship indicator remains is good shape
- The breadth-thrust indicator also moved back into positive territory – but, once again, not by much
- However, the bottom line is the historical return number is strong with the indicators in their current modes
The State of the “Trade”
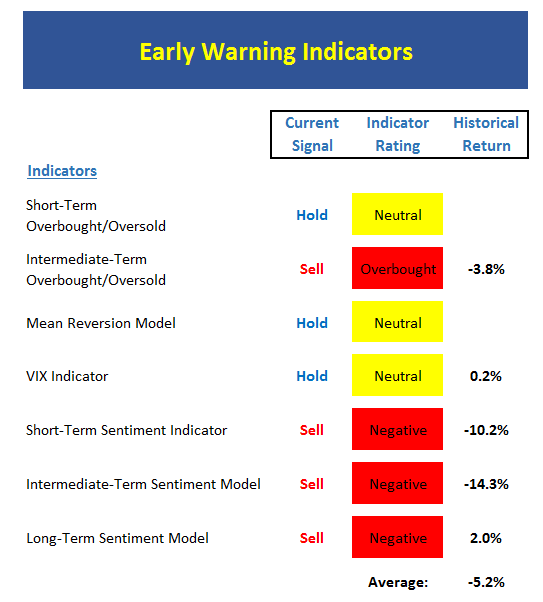
Next up is the “early warning” board, which is designed to indicate when traders may start to “go the other way” — for a trade.
Executive Summary:
- Although the short-term overbought/sold indicator is currently neutral, stock remain overbought from a big picture perspective
- The intermediate- and longer-term overbought indicators are currently all flashing red warning signs
- However, repeat after me… A market that gets overbought and stays overbought is considered positive
- The intermediate-term VIX indicator has not been able to dip down far enough to issue a reversal signal
- The mean-reversion models suggest stocks are vulnerable but a pound-the-table reversal signal is not at hand
- All three sentiment models remain negative
- In sum, this board suggests a reversal is possible at any time
The State of the Macro Picture
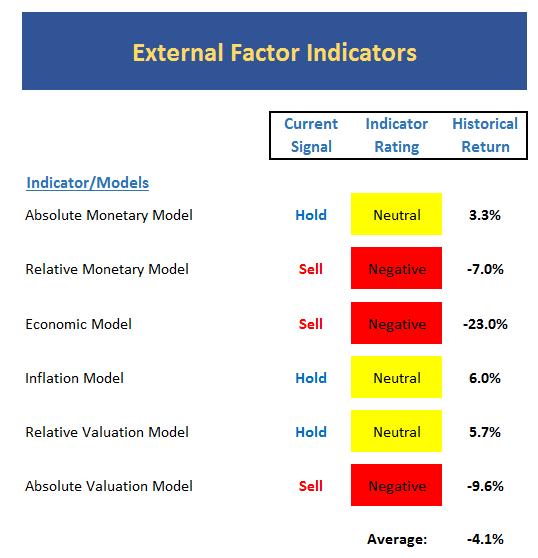
Now let’s move on to the market’s “external factors” – the indicators designed to tell us the state of the big-picture market drivers including monetary conditions, the economy, inflation, and valuations.
Executive Summary:
- There are BIG changes on the External Factors board this week
- The Absolute Monetary model slipped to neutral
- The Relative Monetary model remains negative
- The Economic model (designed to “call” the stock market) moved into the “very negative” zone
- However, the econ model designed to “call” the economy suggests strong growth
- The Inflation model is very close to moving into the “high inflation expectations” zone
- The Relative Valuation model has moved to neutral in recent weeks
- In sum, the rise in interest rates is starting to have an impact on our external factor models
The State of the Big-Picture Market Models
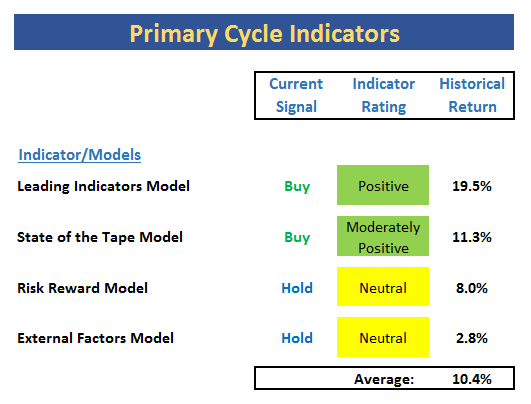
Finally, let’s review our favorite big-picture market models, which are designed to tell us which team is in control of the prevailing major trend.
Executive Summary:
- Although there are worrisome changes on the external factors board above (largely due to rates), there is improvement on Primary Cycle board this week
- The Leading Indicators model has moved back into the positive zone
- The State of the Tape model is now moderately positive
- The Risk/Reward model improved to neutral from negative
- Thus, the overall “state” here is decent
- The historical return average is slightly above the mean
The Takeaway…
The headlines blare that the NASDAQ continues to march to new highs, the Dow is within spitting distance of the 20,000 mark and the S&P 500 is flirting with new all-time highs. However, there are two key points to make as we enter this holiday-shortened week. First, the NASDAQ is the only index making new highs at the present time. The rest of the major indices are stuck in a sideways trading range. In addition, this weeks’ boards suggest that once you move away from the trend indicators, things are not as rosy as you might think. But with the seasonal winds at the bulls’ back, the earnings parade starting to roll, and the inauguration on the horizon, those seeing the market’s glass as at least half full would appear to have the edge in the near-term. Therefore, a buy-the-dips strategy continues to make sense here.
Disclosures: Modern times demand modern portfolios!


