
Small-Caps Act Strong – On Verge Of Major Breakout Or Triple Top?
There are some interesting dynamics in play in the small-cap sector – encompassing both fundamentals and technicals.
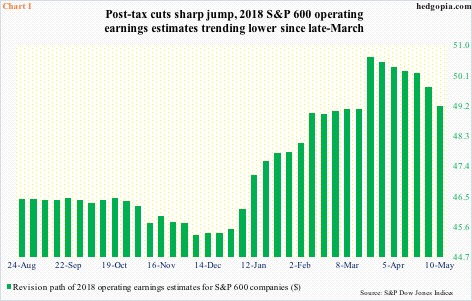
Post-tax cuts of last December, earnings estimates were sharply revised higher. The Tax Cuts and Jobs Act of 2017 was signed into law on December 22. On December 21, operating earnings estimates for 2018 were $145.31 for S&P 500 companies, $97.60 for S&P 400 and $45.41 for S&P 600. As of last Thursday, they respectively stood at $157, $105.93 and $49.19.
In the latest week, 2018 estimates for both S&P 500 and 400 companies fell week-over-week, down $0.65 and $0.73, in that order. The prior week was a record. In the case of the 600, however, estimates peaked a lot earlier – they were $50.66 on March 22 (Chart 1).
This sort of goes against the conventional wisdom that the tax cuts should benefit the domestically-oriented small-cap companies more than their larger-cap brethren, both mid and large. Small-caps’ earnings revision trend has decidedly turned lower.
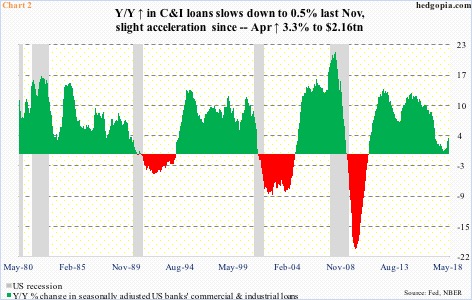
This is also coming at a time when year-over-year growth in US banks’ commercial and industrial loans is picking up speed. At least that has been the case in recent months.
In April, C&I loans grew 3.3 percent y/y to a seasonally adjusted annual rate of $2.16 trillion. On an absolute basis, this is a new record. Relatively, though, y/y growth peaked at 12.9 percent in January 2015. By last November, this had decelerated to merely 0.5 percent, followed by slight acceleration since (Chart 2).
It is hard to tell if small businesses are taking part in this latest spurt in borrowing, or to what extent if they are. They do remain optimistic. The NFIB optimism index in April inched up one-tenth of a point month-over-month to 104.8, with February’s 107.6 the second highest level in the survey’s history (monthly data goes back to 1986).
One probable reason behind this jump in optimism is improved earnings.
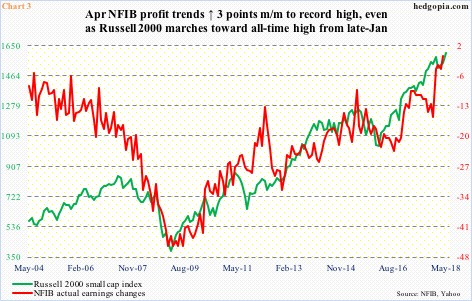
In April, the frequency of positive profit trends among small businesses rose three points m/m to a new high (Chart 3). Notice the jump in the red line – from minus 15 last December to April’s minus one. This particular index measures actual earnings changes, not so much prospects, and for that purpose Chart 1 is where better insight can be had.
In other words, the hunky-dory earnings scene projected by the profit trend in Chart 3 does not jibe with the revision trend in operating earnings for S&P 600 companies in Chart 1.
Nonetheless, the Russell 2000 small cap index has followed the red line in Chart 3 higher.
Currently, small-caps act the strongest among its peers.
Major US equity indices all peaked late January, followed by a mini-collapse before putting in a reversal low on February 9. After plenty of back-and-forth action, the Russell 2000 is the only index to rally to test its old highs.
Flows are in cooperation. Since February 9 through this Monday, IWM (iShares Russell 2000 ETF) and IJR (iShares core S&P small-cap ETF) combined took in $1.7 billion (courtesy of ETF.com). In contrast, SPY (SPDR S&P 500 ETF), VOO (Vanguard S&P 500 ETF) and IVV (iShares core S&P 500 ETF) lost $14 billion during that time.
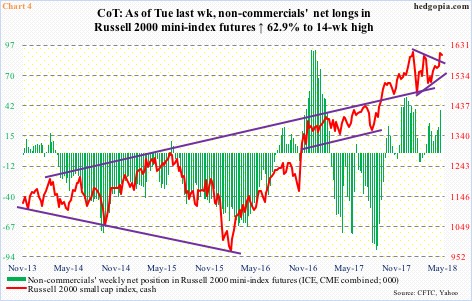
Non-commercials, too, lent a helping hand. In the week ended April 10, they were net long 10,665 contracts in Russell 2000 mini-index futures. As of Tuesday last week, this had swollen to 38,145 contracts (Chart 4). These traders rode the latest rally perfectly. The question then becomes, what next?
It is a pertinent question to ask as small-caps are at a crucial juncture.
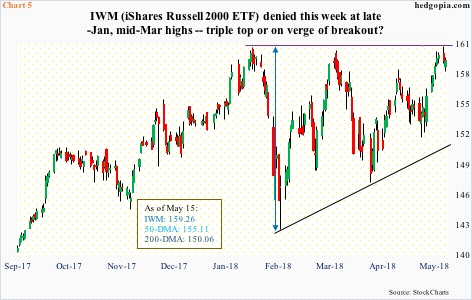
Since the reversal low on February 9, the Russell 2000/IWM have made higher lows. On January 24, IWM peaked at $160.62. This was unsuccessfully tested on March 13 as the ETF retreated after hitting $160.30. This Monday, the February high was surpassed by $0.09 intraday before reversing slightly lower (Chart 5). (On the Russell 2000, however, Monday’s intraday high of 1614.24 fell a little short of the prior high of 1615.52 on January 24.)
Should a convincing breakout occur and technicals were to prevail subsequently, IWM can add 18 points (measured-move target arrived at as shown by the double-sided arrow in Chart 5). This is a very optimistic scenario. On the pessimistic side, IWM could very well be in the midst of forming a triple top.
Here is what the bulls do not want to see. A feeble breakout – either right away or a little later – takes out stops, but fund flows and non-commercials do not jump on board. A false breakout will be a big tell, should things evolve this way.
Disclaimer: This article is not intended to be, nor shall it be construed as, investment advice. Neither the information nor any opinion expressed here constitutes an offer to buy or sell any ...
more

