
Skepticism About The Rally
The market is in the irrational exuberance stage at the moment as even the Italian bank stocks have been rallying this week. As I mentioned in my last post, the indicators in the economy have improved. However, the market was already priced as if they were improving, so it shouldn’t be rallying as much as it is based on some decent data and a lot of hope for 2017. We will see if Trump can deliver. In this article, I will give you some charts that may give you some pause about buying into the hype machine.
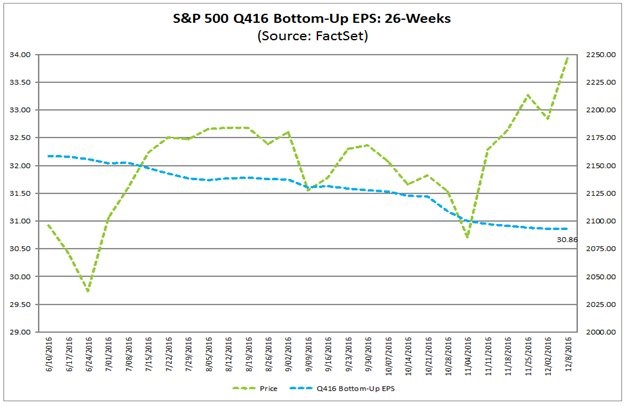
The first chart is from FactSet. It shows the trend in expectations for Q4 earnings. As you can see, the market has rallied while analysts cut their estimates. The current expectations are for 3.3% growth. There is still much ground to be made up from the declines we’ve seen in the past few quarters. Markets are clearly not considering earnings when valuing stocks. There is no direct relationship in this chart and there hasn’t been one all year.
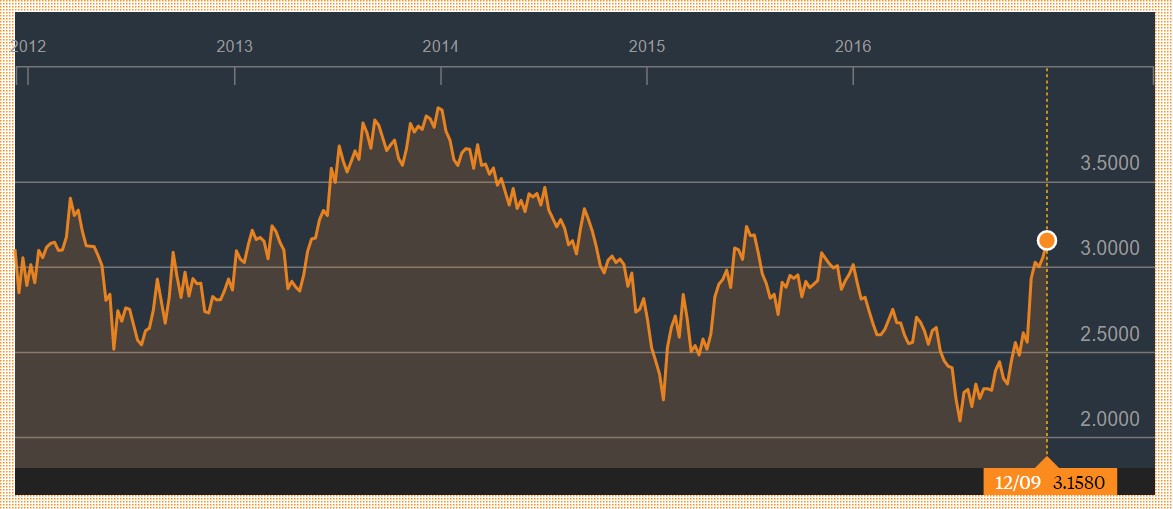
The rally in stocks is being driven by an asset rotation out of government bonds and into stocks. With inflation expectations rising, fixed income investors require higher yields from government bonds. As you can see from the chart below, the 30-year bond yield has increased by over 1% from the bottom in July. The argument for buying stocks because fixed income yields are so low is proving to be correct. The question is how long this rotation can last. Verizon (VZ) stock has risen 10% this month and is now yielding 4.49%. At this rate, we could see the 30-year bond yield meet Verizon’s dividend yield at about 4% in a few months. I was wrong about this asset rotation because I felt both U.S. government bonds and stocks were in a bubble. I didn’t see why investors would move to stocks because they are expensive. However, we are in a TINA (there is no alternative) situation so money is flowing into stocks.
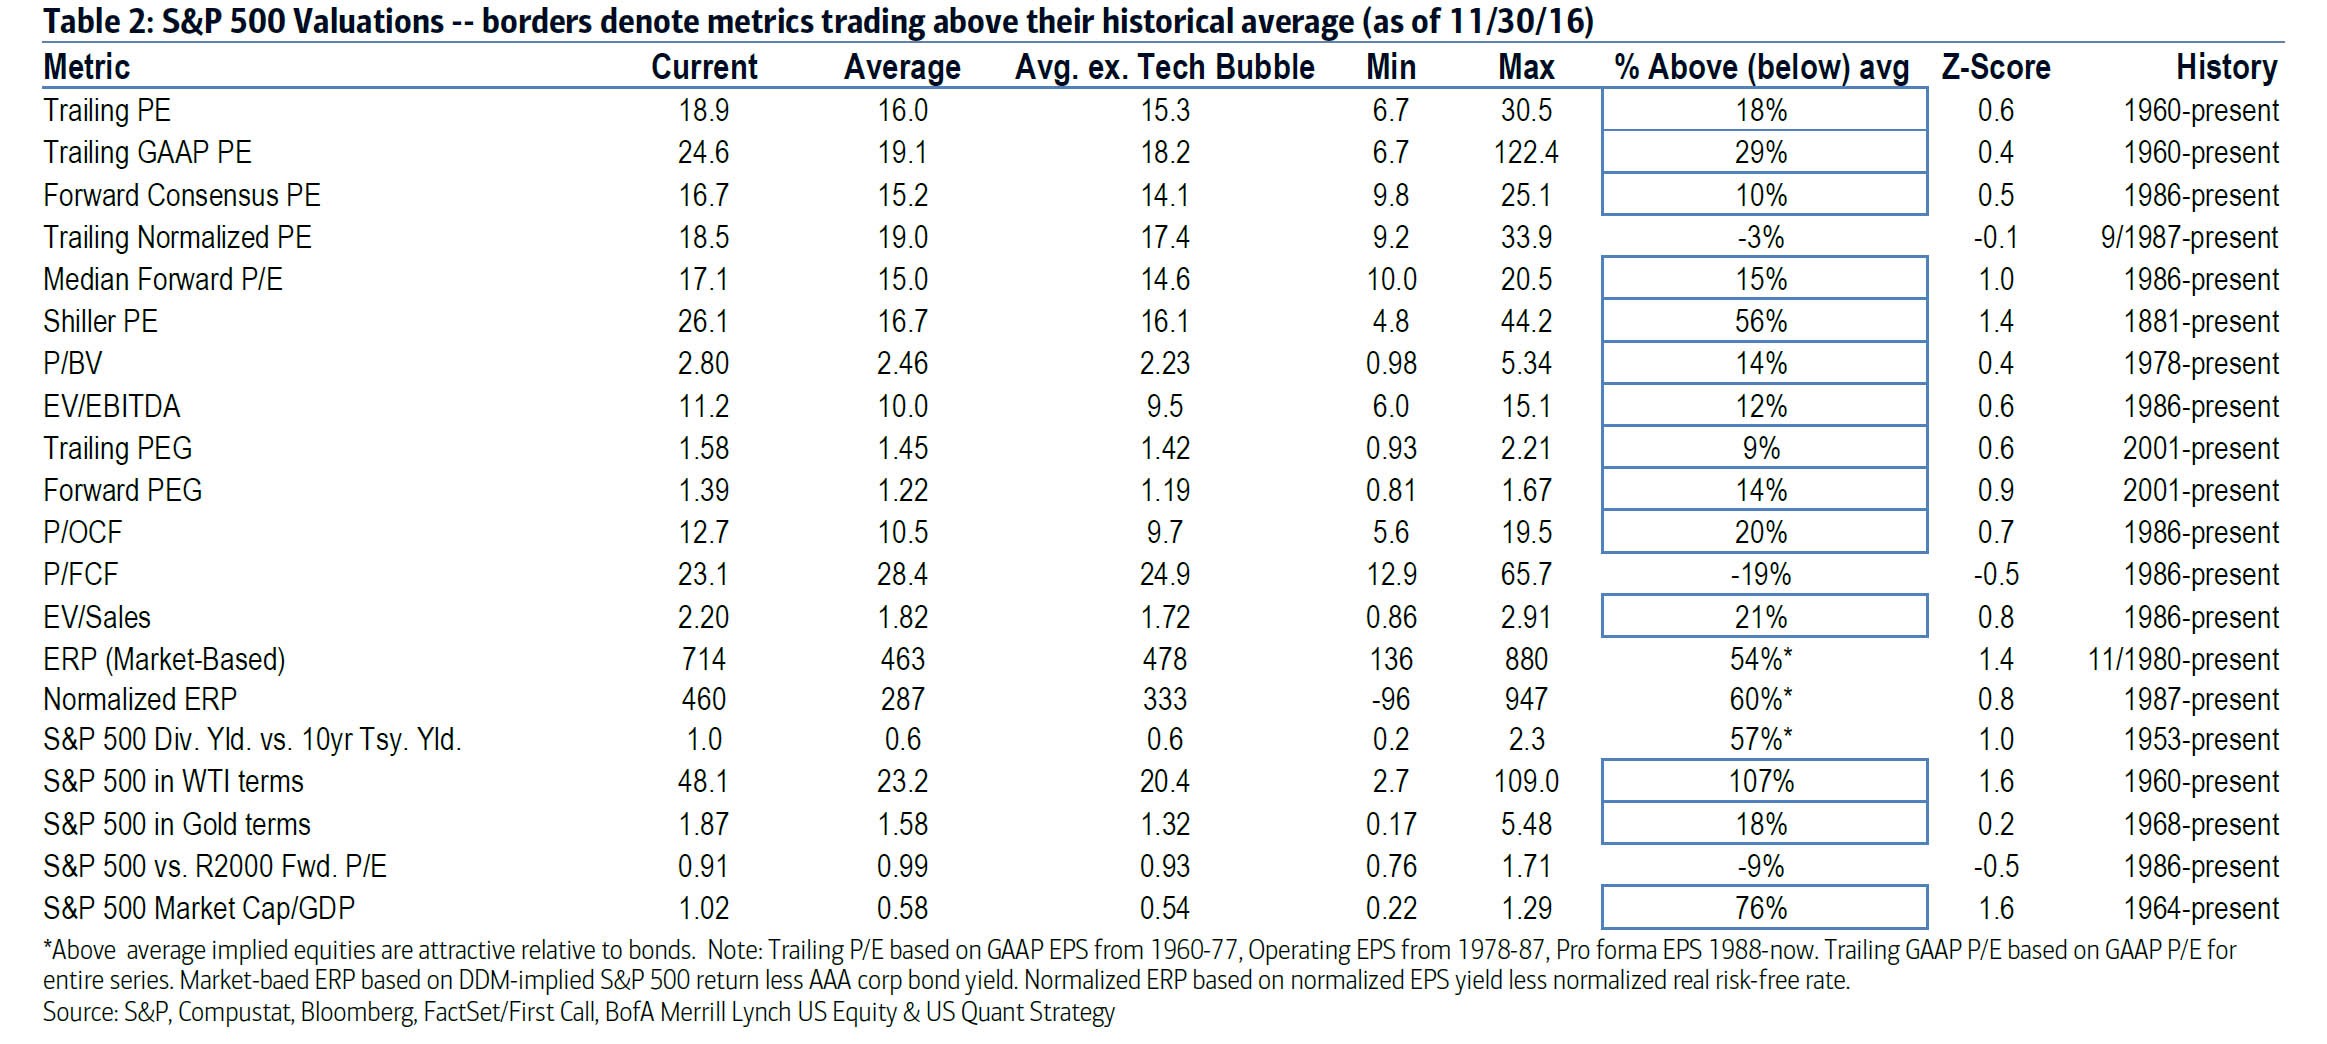
The chart below reviews the various valuation metrics for stocks. Of the 20 metrics 14 show it is overvalued and 6 show it is undervalued. These valuations are from November 30th. The S&P 500 has rallied 2.76% since then, so the trailing normalized PE is now at the historical average. Three of the other metrics showing the market is cheap is compared to bonds. The problem is stocks look cheaper than they are because firms use low interest rates to borrow money to buy back their stock. If interest rates move higher and firms can no longer borrow cheaply, they will look even more expensive than they look now.
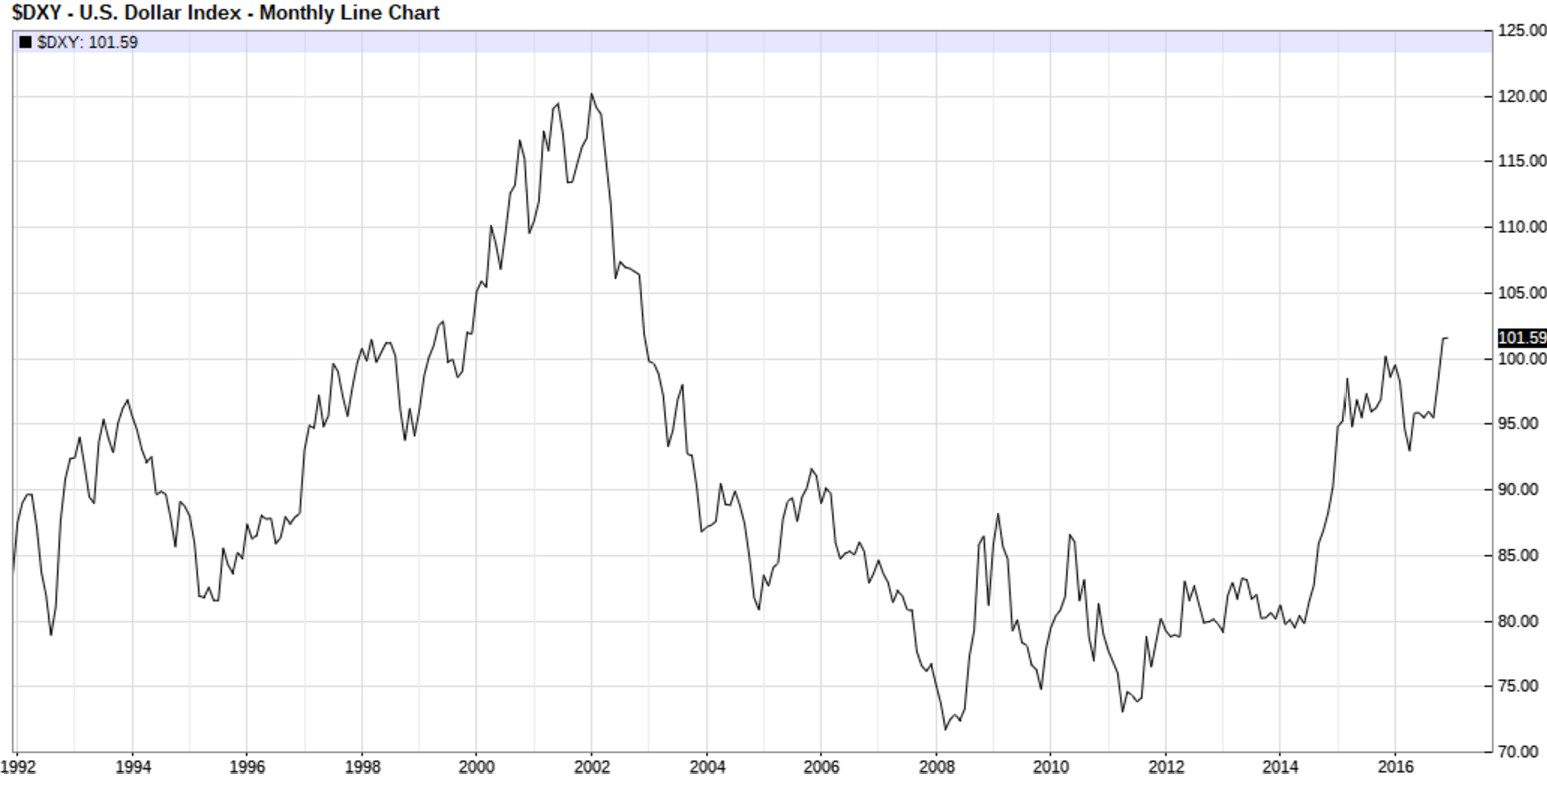
One of the major headwinds facing corporate earnings in 2017 is the strong dollar. The dollar has been rallying to its cycle high once again. If interest rates continue to rise because investors are swapping out of bonds into stocks, then the dollar will rally higher and corporate earnings will suffer.
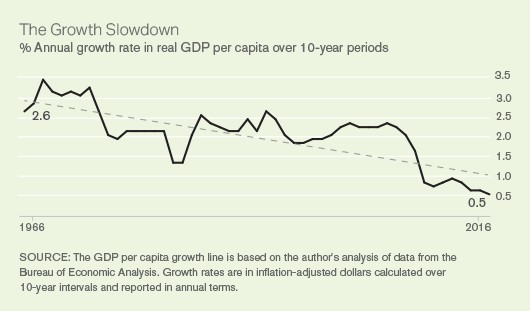
The chart below shows the annual real GDP growth per capita over 10 year periods. It’s amazing the stock market has been able to reach all-time highs with this weak trend. The economy has become financialized; Wall Street does well while Main Street gets crushed. Wall Street is supposed to reflect how the economy is doing. Because it isn’t doing that, I call it a bubble.
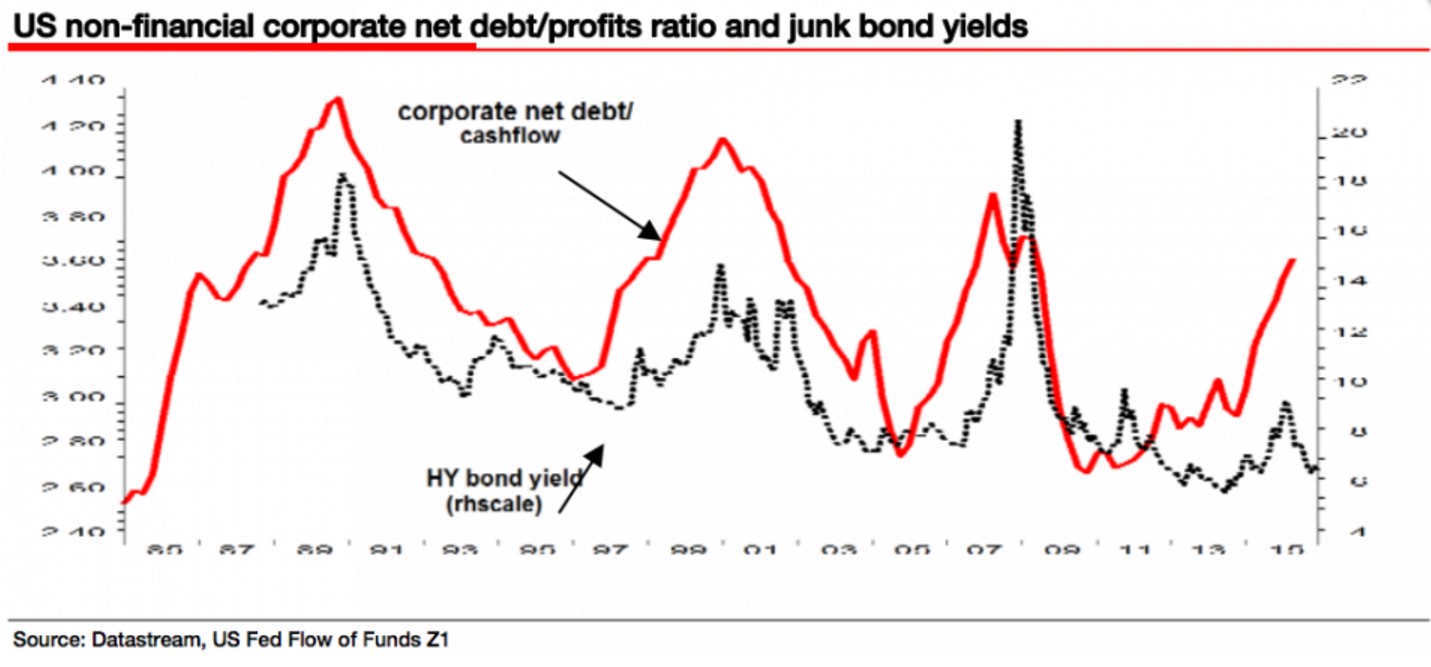
My favorite chart is the one below. In the past 30 years, the net debt to cash flow ratio matched with junk bond yields. In this cycle, profits and debt do not matter as investors pile into junk debt because of central bank brought liquidity. There’s clearly a bubble in junk bonds, but it’s tough to say when it will re-couple with reality. It’s like wondering when an insane person will have a rational thought. He may never have one or he may have one next week.
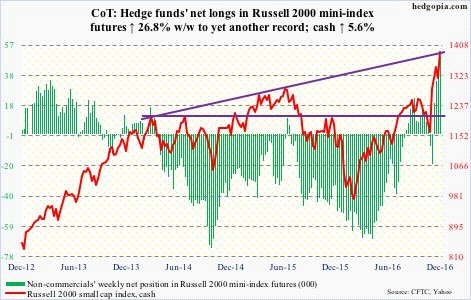
The chart below shows what you could assume was true based on the recent rally in small caps. Hedge funds’ net longs in the Russell 2000 futures have made a week over week record. Someone has to be buying the small cap index for it to be rallying this much. The investors buying this week are chasing momentum. Chasing momentum is a dangerous game, but staying away from this rally is a way to lose your job if you manage money. If you were cautious this year, you underperformed the market and needed to dive into stocks to make your year. Whenever an investor is buying stocks without regards to what price they are paying, it signals a bubble.
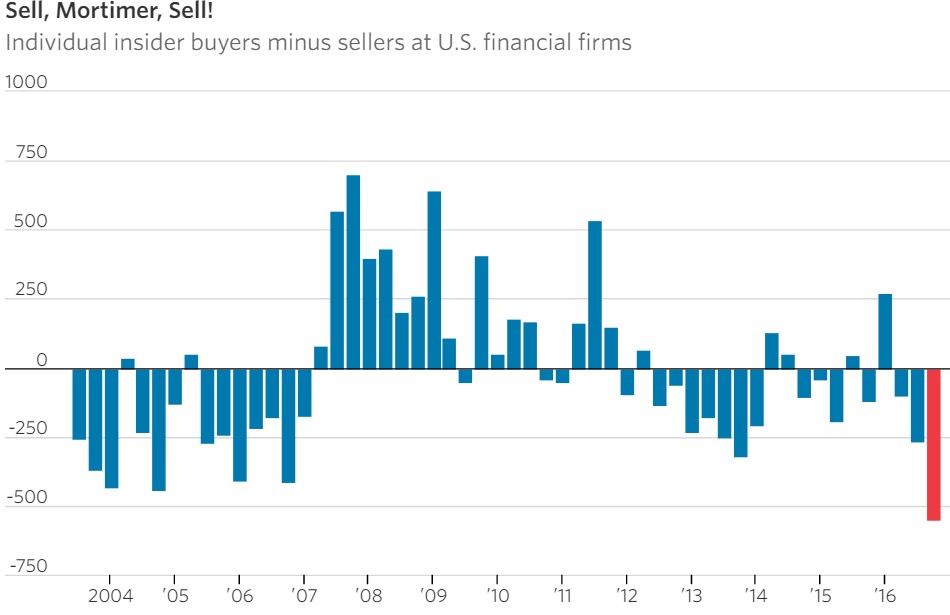
The final chart shows the insider selling at U.S. financial firms. It’s a reflection of the rally in the banks in the past few months. Goldman Sachs (GS) stock is about to make a record high. The people at Goldman Sachs are smart enough to sell high and buy low. These insider transactions have had a great track record. Insider selling is stronger now than it was before the financial crisis. This portends an increase in volatility in 2017. If the rally continues, the insider selling will further its trend.
Conclusion
This article has a few reasons why you shouldn’t follow the herd off the cliff as they buy stocks without regards to valuations. While it may seem like the rally will never end, it seemed like the rally in treasuries would last forever as well. That rally lasted a few decades before selling off in the past few months. It’s not guaranteed to be over as we could still see the trend resurface, but it shows that markets can change when you would least expect them to do so.
Disclaimer: Neither TheoTrade or any of its officers, directors, employees, other personnel, representatives, agents or independent contractors is, in such capacities, a licensed financial adviser, ...
more


Thanks for sharing
Thanks for sharing