Simmons First National Leads Top Upgrades
Using valuation and forecast figures, you can rank and rate our covered stocks against each other, to find out, in an objective and systematic way, the most attractive investment targets based on your own risk/reward parameters. We re-calculate the entire database every trading day, so you are assured that every proprietary valuation and forecast data point is as up-to-date as possible.
So, for today's bulletin we used our website's advanced screening functions to search for UPGRADES to BUY or STRONG BUY* with complete forecast and valuation data. They are presented by one-month forecast return. Simmons First National Corp (SFNC) is our top-rated upgrade this week.
|
Ticker |
Company Name |
Market Price |
Valuation |
Last 12-M Return |
1-M Forecast Return |
1-Yr Forecast Return |
P/E Ratio |
Sector Name |
|
SIMMONS FIRST A |
47.05 |
-7.49% |
6.23% |
0.56% |
6.68% |
14.26 |
Finance |
|
|
INSIGHT ENTRPRS |
31.6 |
20.92% |
20.29% |
0.54% |
6.47% |
13.62 |
Retail-Wholesale |
|
|
PENNEY (JC) INC |
10.55 |
-50.68% |
27.57% |
0.53% |
6.33% |
N/A |
Retail-Wholesale |
|
|
CELANESE CP-A |
65.73 |
-10.45% |
2.05% |
0.51% |
6.10% |
10.56 |
Basic Materials |
|
|
EZCORP INC CL A |
9.06 |
-10.71% |
49.50% |
0.51% |
6.07% |
N/A |
Finance |
*Note: There are no STRONG BUY companies in this list. They are all BUY-rated stocks.
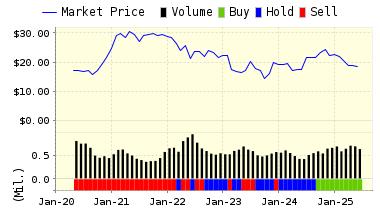
Below is today's data on Simmons First National Corp (SFNC):
SIMMONS FIRST NATIONAL CORP bank holding company registered under the Bank Holding Act of 1956. Through its subsidiaries, Co. provides a full range of banking and mortgage services to individual and corporate customers.
VALUENGINE RECOMMENDATION: ValuEngine updated its recommendation from HOLD to BUY for SIMMONS FIRST A on 2016-08-12. Based on the information we have gathered and our resulting research, we feel that SIMMONS FIRST A has the probability to OUTPERFORM average market performance for the next year. The company exhibits ATTRACTIVE Sharpe Ratio and P/E Ratio.

|
ValuEngine Forecast |
||
|
Target |
Expected |
|
|---|---|---|
|
1-Month |
47.31 | 0.56% |
|
3-Month |
47.61 | 1.19% |
|
6-Month |
47.83 | 1.66% |
|
1-Year |
50.19 | 6.68% |
|
2-Year |
48.15 | 2.34% |
|
3-Year |
44.07 | -6.34% |
|
Valuation & Rankings |
|||
|
Valuation |
7.49% undervalued |
Valuation Rank(?) |
|
|
1-M Forecast Return |
0.56% |
1-M Forecast Return Rank |
|
|
12-M Return |
6.23% |
Momentum Rank(?) |
|
|
Sharpe Ratio |
0.53 |
Sharpe Ratio Rank(?) |
|
|
5-Y Avg Annual Return |
12.86% |
5-Y Avg Annual Rtn Rank |
|
|
Volatility |
24.23% |
Volatility Rank(?) |
|
|
Expected EPS Growth |
3.84% |
EPS Growth Rank(?) |
|
|
Market Cap (billions) |
0.85 |
Size Rank |
|
|
Trailing P/E Ratio |
14.26 |
Trailing P/E Rank(?) |
|
|
Forward P/E Ratio |
13.73 |
Forward P/E Ratio Rank |
|
|
PEG Ratio |
3.71 |
PEG Ratio Rank |
|
|
Price/Sales |
1.97 |
Price/Sales Rank(?) |
|
|
Market/Book |
1.19 |
Market/Book Rank(?) |
|
|
Beta |
1.02 |
Beta Rank |
|
|
Alpha |
-0.02 |
Alpha Rank |
|
ValuEngine Market Overview
|
Summary of VE Stock Universe |
|
|
Stocks Undervalued |
53.42% |
|
Stocks Overvalued |
46.58% |
|
Stocks Undervalued by 20% |
22.08% |
|
Stocks Overvalued by 20% |
14.99% |
ValuEngine Sector Overview
|
Sector |
Change |
MTD |
YTD |
Valuation |
Last 12-MReturn |
P/E Ratio |
|
-0.97% |
0.24% |
52.41% |
11.16% overvalued |
54.87% |
33.23 |
|
|
-0.23% |
1.35% |
8.62% |
9.32% overvalued |
6.88% |
20.61 |
|
|
0.30% |
0.85% |
10.05% |
9.27% overvalued |
8.52% |
24.28 |
|
|
-0.51% |
1.55% |
14.99% |
6.20% overvalued |
3.96% |
22.99 |
|
|
-0.32% |
-1.88% |
11.77% |
3.64% overvalued |
10.23% |
22.35 |
|
|
-0.03% |
1.26% |
-1.42% |
2.13% overvalued |
-2.86% |
19.32 |
|
|
0.28% |
1.36% |
13.82% |
0.58% overvalued |
3.91% |
29.73 |
|
|
0.19% |
1.42% |
15.45% |
0.07% overvalued |
-12.69% |
24.49 |
|
|
-0.01% |
1.23% |
6.30% |
0.84% undervalued |
1.22% |
16.28 |
|
|
-0.18% |
0.96% |
8.29% |
1.37% undervalued |
-2.74% |
23.63 |
|
|
-0.30% |
-0.12% |
29.17% |
1.89% undervalued |
5.68% |
21.14 |
|
|
-0.07% |
-0.38% |
13.59% |
6.09% undervalued |
-3.53% |
24.68 |
|
|
-0.36% |
-0.27% |
10.54% |
6.46% undervalued |
-19.44% |
15.88 |
|
|
0.12% |
1.33% |
2.35% |
7.77% undervalued |
-4.99% |
22.27 |
|
|
-0.21% |
-0.73% |
0.81% |
9.32% undervalued |
-17.08% |
27.48 |
|
|
-0.32% |
2.33% |
4.31% |
9.38% undervalued |
-2.79% |
15.98 |
VALUATION WATCH: Overvalued stocks now make up 46.58% of our stocks assigned a valuation and 14.99% of those equities are calculated to be overvalued by 20% or more. Eight sectors are calculated to be overvalued.
Disclaimer: ValuEngine.com is an independent research provider, producing buy/hold/sell recommendations, target price, and ...
more


