
Secrets To The Hottest Trade - Shorting VIX
Financial regulations such as the Dodd-Frank Act and Volcker Rule were constructed to keep large banks from straying from their core lines of business. As these rules have been incrementally implemented over the past five years or so, realized volatility has only spiked above 20 twice.
Market expectations for volatility seemingly overestimated the frequency that these elevated levels would occur. We can explore the numbers during this period of increased regulation to compare market expectations vs. realized volatility.
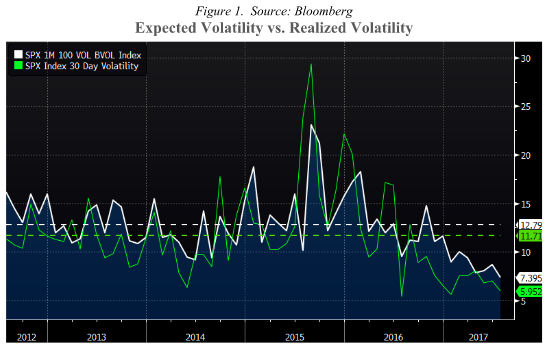
Using the S&P 500 as a proxy, for the five year period ending 7/31/2017, we see the one month expected volatility (white - 1 month implied volatility) on average was over 1% higher than what the volatility ended up being (green - lagged one month realized volatility).
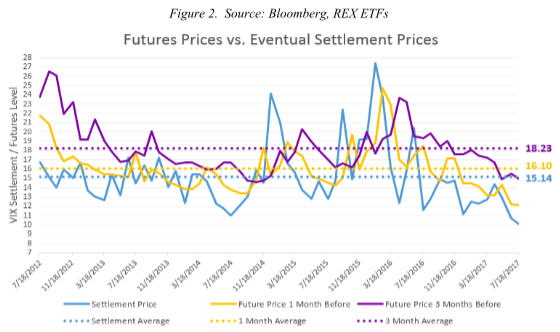
We get even more drastic results when inspecting this concept using the VIX index. Exposure to movements in the VIX index is possible via derivatives or by regulated products that utilize them. Figure 2 shows the relationship between the settlement price of VIX and lagged generic 1 & 3-month VIX futures.
The average 3-month futures closing price was 309 bps higher than the level in which the future settled during this period. For the five year period ending in July 2017, a short futures position in VIX entered three months before expiration, settled on average 16.9% (18.23 vs. 15.14) lower than entry1. The average futures price 1-month before settlement was 95 bps 1 higher than at settlement. A short position in 1-month contracts over this period settled at an average value of 5.9% (16.1 vs. 15.14) lower than entry1. Rolling 1-month contracts could be repeated 3 times as often as 3-month contracts leading to 3 times the average value difference2. During this period, the shorter-duration strategy (5.9% *3 = 17.7%) hypothetically would have seen more of a valuation change than shorting 3-month contracts on average.
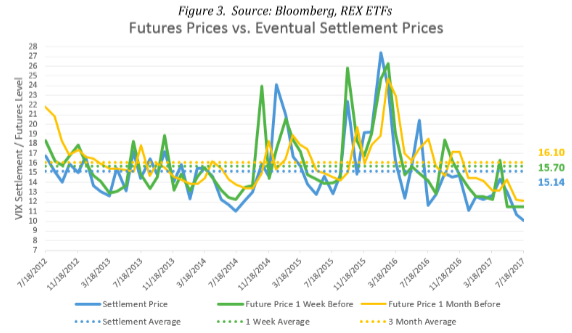
Now that weekly VIX settlement contracts are available, rolling even shorter duration futures can be examined. Running the same analysis as before, but examining VIX futures one week before settlement, Figure 3 shows an average value drop of 3.5% per trade (for only one week!).
Continuously rolling the average change in value for 1-week contracts comes to over 42% 2 per three-month period on average.
Supplementing monthly contracts with even shorter contract lengths, such as ones with 1 or 2 weeks in duration, rolling happens much more frequently. Figure 4 shows the VIX futures curve as of 7/31/2017. At this point in time, 1 & 2 week forward VIX expectations are higher than the spot (current) value. A 2-week futures contract is priced at 11.35. If the level of VIX stayed constant for two weeks or ended at the same level, the value of a short position would be over 9% higher at settlement 2 (sell at 11.35, then buy at 10.29).
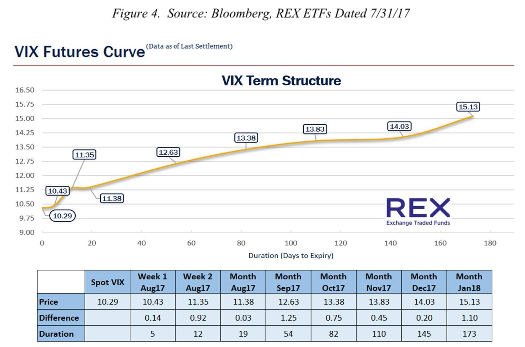
The VIX may not remain constant, but as long as the forward market expectations are higher than the spot level, there is an imbedded price cushion. In the 7/31 example, the spot VIX level of 10.29 could increase by 10% and still be lower than the 11.35 Week 2 August contract selling price. If the spot VIX spikes to a level higher than settlement value, whatever short-position contracts settle during that time will be at a loss. However, in this case the new future contracts being rolled into may be at an even higher selling price. Short duration futures allow for a larger sample size of completed entry-to- exit rolls than longer duration futures - mathematically establishing less standard error around the mean value change assuming there is no monthly cyclicality to VIX levels.
The REX VolMAXX Inverse VIX Weekly Futures Strategy ETF (NYSEMKT:VMIN), which implements a short-term VIX futures selling strategy, returned over 280% since 5/2/2016 (inception) to 7/31/2017 while the starting VIX value was 14.6 and the ending value was 10.26, a decrease of less than 30%. Much of the performance was due to the short-term rolling of futures contracts.
Footnotes:
- Entry is the price agreed upon to transact in the future. All trades are assumed to be entered at the stated closing prices with no transaction costs.
- Without compounding or trading costs
Disclosure: The annualized net asset value return from inception (5/2/2016) to June 30, 2017 was 181.15% and the annualized market price return was 181.10% for the same period. The second ...
more

