
Russell 2000 Leading The Charge Higher
While the US majors continue to push higher through recent price rotation levels, the IWM (Russell 2000 ETF) is showing investors where strength lies in the markets. Recently, we issued a research report showing that a massive dynamic shift is beginning to take place in the US market that provides an incredible opportunity for investors. Now, we have further proof that this shift is well underway and is likely much further along than we initially expected.
The Russell 2000 is one component of the US market that often reacts to market strength and weakness a bit differently than the S&P, Dow or Nasdaq index. The reason for this is that the Russell 2000 index makes up a broader scope of trading symbols that represent a greater chunk of the total market segment. The US majors don’t always follow the Russell 2000, but when the Russell 2000 index breaks recent all-time highs on a broad push higher – we need to pay attention.
Investors need to be very aware that most of the market believes the recent Feb 2018 price rotation setup a completed Elliot Wave 5 TOP. Yet, we believe this analysis is incorrect and we believe the markets are setting up for an extended Wave C or compounded Wave C that will drive market prices much higher over the next few months. The fact that the IWM (Russell 2000) has breached recent all-time highs and is now pushing into uncharted high price territory is critical to our understanding of the future price moves for the US Majors.
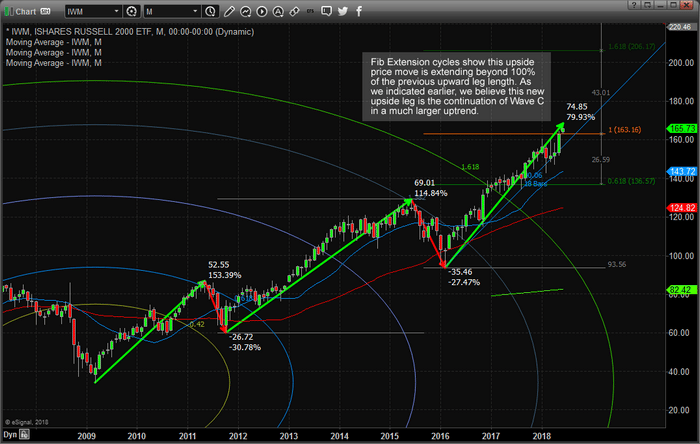
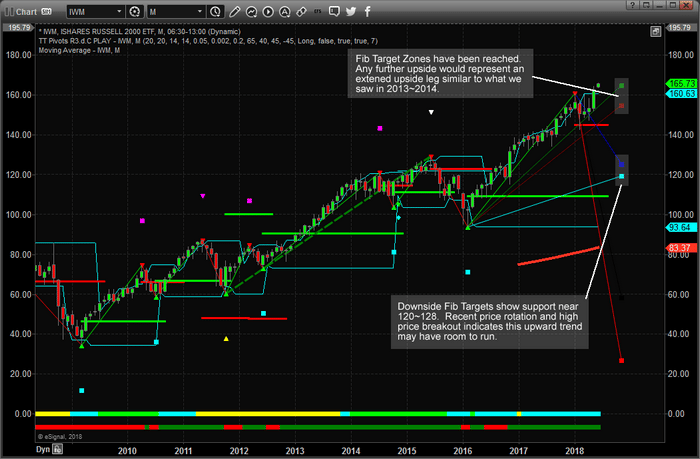
With the Russell 2000 driving upward price action, clearing recent high price peaks and closing May with an incredible upside price move, we look to our advanced price modeling systems to help us understand the potential future price moves. This next chart shows our Fibonacci predictive price modeling system and clearly shows the “Fib Target Zones” near the right side of this chart. Current prices are already near these target zone levels – yet they can extend well beyond these levels when price dynamics “expand”. Therefore, should the upside trend expand as we expect, we believe the upside potential in the IWM to be at least 15~20% higher from these current levels.
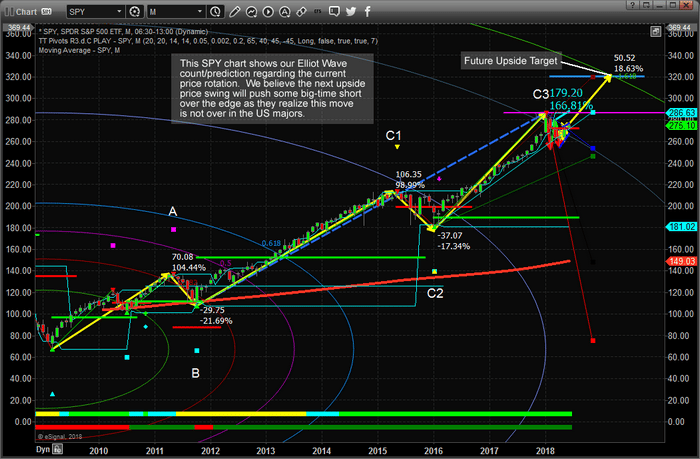
This SPY chart showing our proprietary Fibonacci predictive price modeling system shows what we believe to be the correct Elliot Wave count and shows “C3” where the current price peak/high price rotation exists. We believe this rotation is not a completed wave 5 – but a compound wave C that will continue higher to form a full 5 leg wave C move. If we are correct, this market has at least 15% more to the upside and the S&P and Dow stocks will likely be the big winners in this move.
Our recent analysis suggested that a massive capital shift is taking place in the US markets where the Nasdaq may be nearing a temporary price peak and where the S&P and Dow stocks may still have room to run. This shift indicates that the blue chips and S&P leaders may be the big runners over the summer months. Currently, Russell 2000 leaders may also benefit from this move given this recent research.
Disclosure: If you want to know where the market is headed each day and week, well in advance then be sure to join my Pre-Market Video Forecasting service which is: more


