Richmond Fed Manufacturing Survey Again Improves In March 2017

Of the five regional Federal Reserve surveys released to date, all are in expansion.
Analyst Opinion of Richmond Manufacturing
For the fourth month, the regional Fed surveys seem to be saying uniformly that growth is expanding. The Richmond Fed subcategories were strong - especially new orders.
Market expectations from Bloomberg / Econoday was 15.0 to 15.0 (consensus 15.0). The actual survey value was +22 [note that values above zero represent expansion].
Manufacturers in the Fifth District were generally upbeat in March, according to the latest survey by the Federal Reserve Bank of Richmond. The index for shipments and new orders both rose and employment gains were more common. This improvement led to a composite index for manufacturing that rose from 17 in February to 22 in March — the strongest reading for that index since April 2010. In addition to improvement in the employment index, more firms reported longer workweeks and wage increases appeared to be more widespread.
Looking six months ahead, manufacturing executives were generally optimistic, although for some indicators, they were less optimistic than in February. For example, the expected shipments index fell from 53 to 44 and the expected new order index fell from 53 to 48. On the other hand, some indexes rose, such as the indexes for expected employment, average workweek, and wages.
Survey respondents reported that growth in both prices paid and prices received moderated slightly, as did expectations for price growth six months ahead.
Current Activity
Manufacturing activity strengthened in February, pushing the composite index to 17 from the previous reading of 12. The shipments gauge moved three points higher, to settle at a reading of 16, and the index for the volume of new orders jumped to 24 from 15. The backlog of orders also picked up, with that index moving to 8 from 4. Vendor lead times lengthened, with the indicator rising to 9 from January's reading of 5. Finally, the index for capacity utilization nearly doubled from the previous reading, finishing the survey period at 15.
Inventories of raw materials and finished goods rose widely. The index for raw materials inventories added five points in February to reach a reading of 20, while the index for finished goods inventories picked up six points to finish at a reading of 14.
Summary of all Federal Reserve Districts Manufacturing:
Richmond Fed (hyperlink to reports):
z richmond_man.PNG
Kansas Fed (hyperlink to reports):
z kansas_man.PNG
Dallas Fed (hyperlink to reports):
z dallas_man.PNG
Philly Fed (hyperlink to reports):
z philly fed1.PNG
New York Fed (hyperlink to reports):
z empire1.PNG
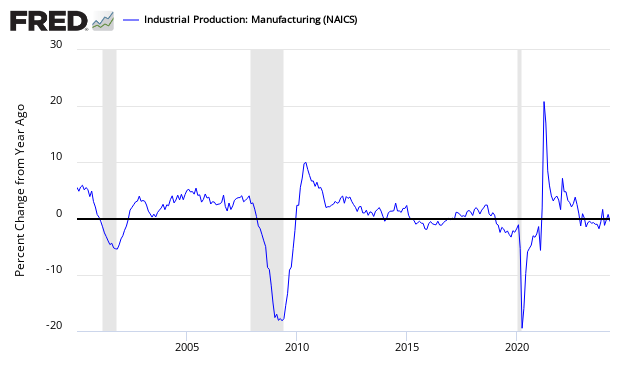
Federal Reserve Industrial Production - Actual Data (hyperlink to report):

Holding this and other survey's Econintersect follows accountable for their predictions, the following graph compares the hard data from Industrial Products manufacturing subindex (dark blue bar) and US Census manufacturing shipments (lighter blue bar) to the Richmond Fed survey (darkest bar).

In the above graphic, hard data is the long bars, and surveys are the short bars. The arrows on the left side are the key to growth or contraction.
Disclosure: None.


