
Relative Opportunity With US Sectors
For tactical momentum positions within the major sectors, we currently favor Technology (XLK or VGT) and Health Care (XLV or VHT) for overweight versus diversified core. Based on various combinations of focus factors, the data suggests these sectors:
- High growth of earnings and interest rates now: XLY, XLI, XLB, XLF
- Reduced growth of earnings and rising interest rates in 2019: maybe XLV, XLE and XLC
- Blended Cyclical and Defensive suitability: XLK, XLE, XLC
- Minimal to positive correlation to rising interest rates: XLF, XLE, XLI, XLB, XLY
- Lower earnings growth at lower cost of growth: XLF, maybe XLB
- Higher earnings growth and lower cost of growth: XLC, XLE, XLY
- Higher 3-5-year earnings growth: XLY, XLC, XLE
- Higher growth in 2019 than 2018: None
- Higher 3-5-year earnings growth than 2018: XLRE, XLY
- Higher 3-5-year earnings growth than 2019: All excluding XLE
- Currently positive 1-year trend momentum: XLY, XLK
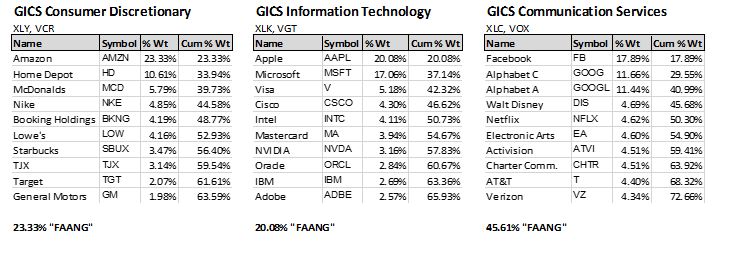
The three sectors newly constituted as of September 28 are shown here represented by their top 10 holdings. The movements out of Consumer Discretionary and Technology into Communications Services, create difficult challenges in effectively comparing current data to historical averages.
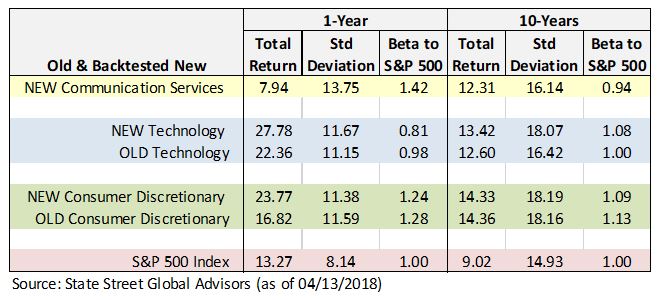
Backtest data provided by State Street Global Advisors shows these historical differences between the old and new sector definitions. We are at somewhat of disadvantage attempting to compare current to historical valuation and other data due to the reconfiguration.
For those of you focused on “FAANG” (FaceBook, Apple, Amazon, Netflix and Google), whether to overweight or underweight, the percentage of FAANG exposure in each of the new sector funds is listed below their top 10 holdings in the tables above.
Within long-term strategic holdings, you can maximize FAANG exposure by owning a short list of mega-cap stocks in a fund such as XLG (Russell top 50) with 25.44% FAANG, minimize with VTI (total US market) with 10.51% FAANG; or marginalize FAANG with RSP (S&P 500 equal weight) with 1%.
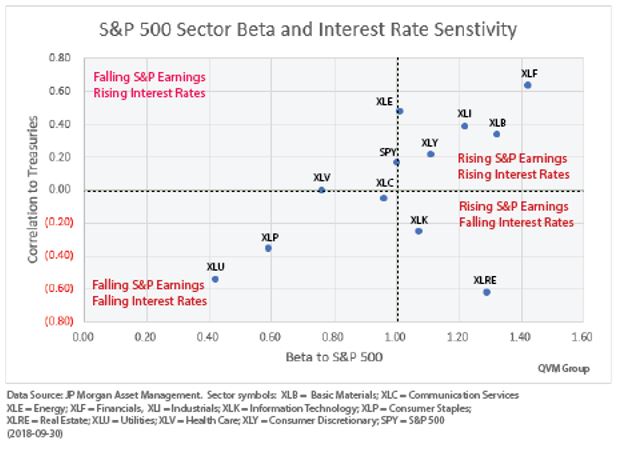
2-Yr Correlation to Treasury Yields vs 10-Yr Beta To S&P 500
(data from JP Morgan Asset Management)
Earnings are expected to grow in 2019 but to moderate significantly from 2018 (approximately 10% versus 20% in 2018), according to FactSet, which would suggest most likely the upper right quadrant sectors, and possibly the upper left, if the moderation in earnings growth took on any of the flavor of approaching declining earnings.
As you will see in a subsequent chart, the interest rate sensitivity of Real Estate, Utilities and Consumer Staples puts them at a disadvantage during the current Fed rate hiking cycle.
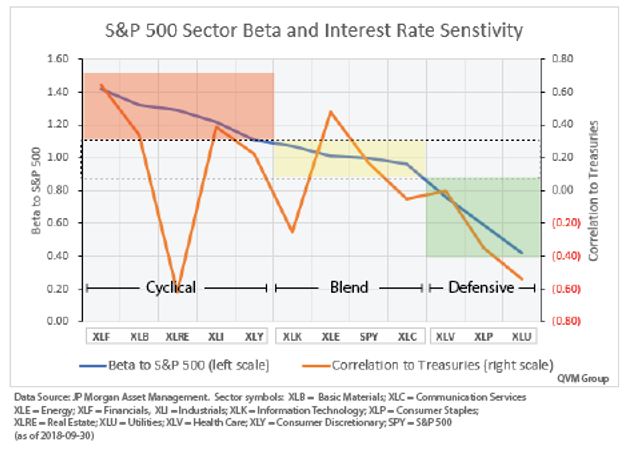
10-Year Beta to the S&P 500
(data from JP Morgan Asset Management)
Sectors with a high Beta are considered Cyclical. Those with a low Beta are considered Defensive. And those with Beta near 1.00 have Blended attributes. Morningstar calls this category, “Sensitive” – sensitive to interest rates but not to the extent of being Cyclical.
Health Care, Consumer Staples and Utilities have low Beta and are viewed as Defensive, and Technology, Energy and Communications Services are considered only Sensitive (or Blended).
It is important to know that these are long-term Beta ratings. You can see in the table of Beta for Communications Services on the first page, for example, that the 10-year Beta is 0.94, an almost Defensive rating, but over 1-year has been 1.42, a definitely Cyclical level.
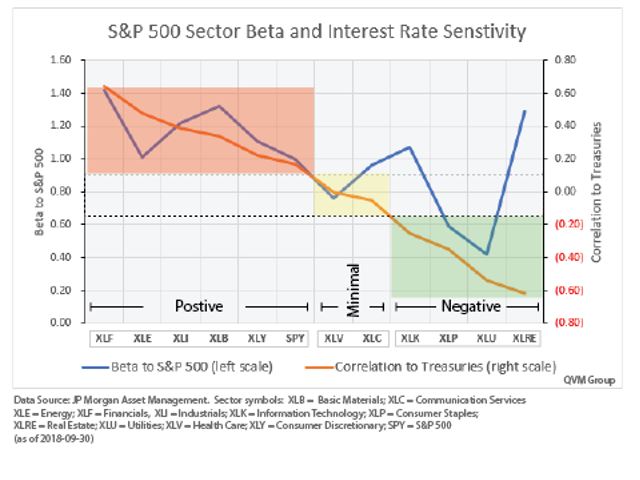
2-Year Interest Rate Sensitivity
(data from JP Morgan Asset Management)
In this rising interest rate period, Financials, Energy, Industrials, Basic Materials, and Consumer Discretionary have tended to react positively to interest rates; while Health Care and Communications Services are minimally reactive to interest rates.
Technology reacts slightly negatively to rising interest rates, and Consumer Staples, Utilities and Real Estate react meaningfully negatively to rising interest rates.
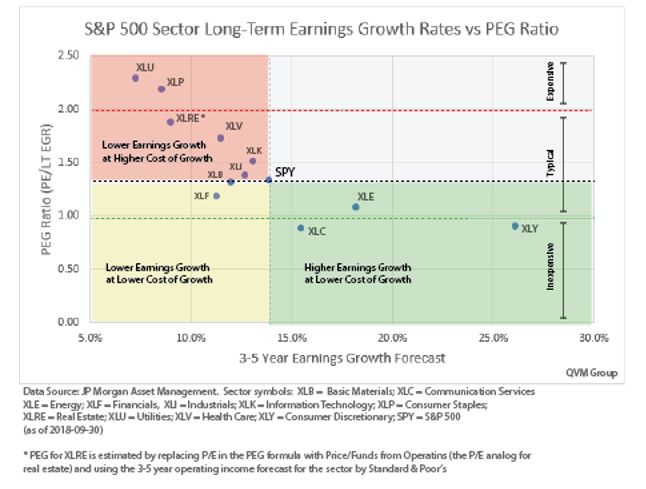
3-5 Year PEG Ratio vs 3-5 Year Earnings Growth Rate Forecast
(data from Standard & Poor’s & FTSE NAREIT)
PEG ratios are the P/E ratio divided by the Earnings Growth Rate Forecast. In the case of Real Estate, we used the current REIT Price-to-Funds from Operations as a substitute for the P/E ratio, and used the S&P Operating Earnings Growth Rate Forecast. Funds-From-Operations are from FTSE NAREIT.
PEG Ratios below 1 are considered inexpensive, and over 2 are considered expensive.
PEG Ratios less than that of the S&P 500 are potentially more attractive because you pay less for growth.PEG ratios above that of the S&P 500 mean you pay more for growth than the index.
Lower PEG Ratios but with growth lower than the S&P 500 (yellow shading) provide growth at a lower price than the S&P 500, but the growth is still lower, and the price increase probability may be expected to be less than if the earnings growth is greater than that of the S&P 500 (green shading).
If the expected growth rate of earnings is lower than the S&P 500 and the PEG ratio is higher than the S&P 500 index (red shading), then the return opportunity is expected to be lower than the index.
Sector Short-Term Momentum- Price Return Only
(data from QVM calculations as of 2018-10-04)
Based on our tactical momentum rotation filter criteria only Information Technology (XLK for large-cap and VGT for all-cap) are attractive.
VGT is eligible for purchase (green) and XLK is eligible for retention (yellow)based on the rules provided below.
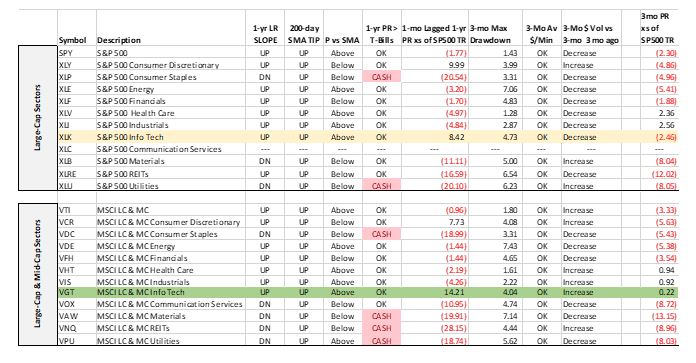
The filter we use to select ETFs for tactical momentum rotation requires at least these things:
- Upward sloping 1-year regression trend line
- 200-day average higher than 1 month ago and price above 200-day average
- Price return 10% or more in excess of both T-Bills total return and S&P 500 total return over 12 months ending 1 month ago
- Maximum drawdown over the last 3 months not more than 10%
- 3-month average Dollar trading volume per minute at least $15,000
To remain in the tactical momentum sleeve of a portfolio the position must continue to satisfy the minimum conditions on a weekly review basis, except that the total return of an ETF, if greater than that of T-Bills, need only exceed that of the S&P 500 by 2%.A position might be replaced with a more attractive tactical selection if the total amount allocated to the tactical sleeve is fully invested.
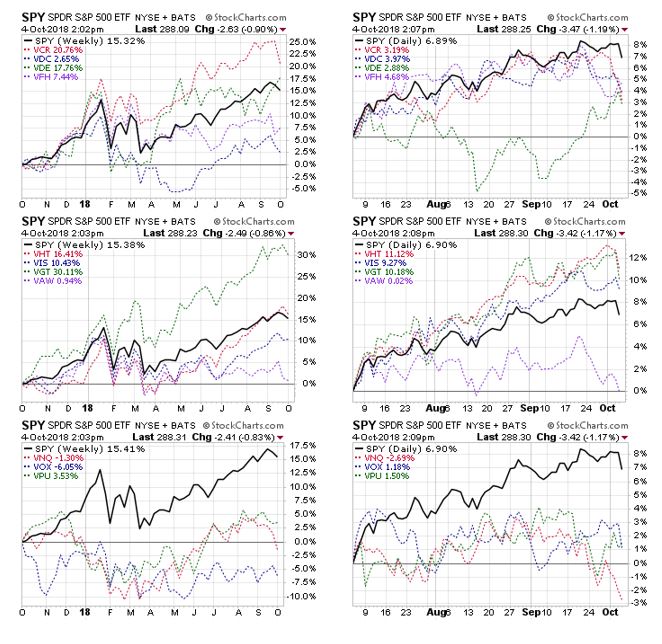
Comparative Price Charts (Vanguard all-cap sector ETFs) – Dividend Adjusted
(1 year weekly and 3 months daily as of mid-day 2018-10-04)
From a 1-year perspective, Technology (VGT, 30.11%) is first.Consumer Discretionary (VCR,20.76%) is second. Energy (VDE, 17.76%) is coming on strong, but has been through large drawdowns that reduce its appeal. Health Care (VHT, 16.41%) is fourth.
From a 3-month perspective, Healthcare is the strongest (11.12%), Technology is second (10.18%), Industrials are third (9.27%), and Financials are fourth (4.68%).
All factors considered, with no perfect choices, my inclination is to hold a core position in the S&P 500 or Total US Market and then overweight with Technology at the major sector level.
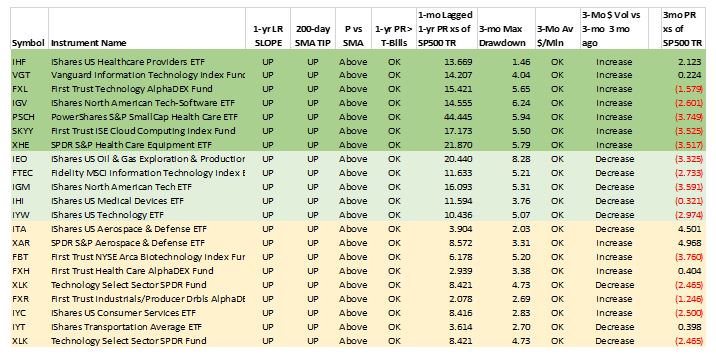
There is more opportunity, however, to find tactical momentum opportunities within sub-sectors, which are primarily in the Technology and Health Care sectors, as this list of specialized ETFs shows:
Among our current tactical sleeve momentum ETF holdings in tax deferred accounts, two (FDN and HACK) no longer meet the retention requirements and will be sold tomorrow:
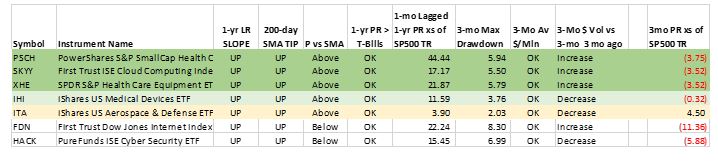
A partial exception is ITA (aerospace and defense) which is held in some accounts as a thematic tactical overweight, as opposed to a momentum overweight, which would exempt it from the short-term performance requirements of a tactical momentum position.
Disclaimer: "QVM Invest”, “QVM Research” are service marks of QVM Group LLC. QVM Group LLC is a registered investment advisor.
Important Note: This report is for ...
more

