
Range Resources: A Strong Buy In The Natural Gas E&P Space
I view the natural gas E&P space as one of the most attractive sectors for investment in the market right now. Natural gas has been in a 7 year bear market and many of the producers are selling at valuations that assume depressed price spreads well into the future. Yet, there are significant macro tailwinds for this sector that leads me to believe that many high quality companies in this sphere have very high upside potential.
Video Length: 00:08:07
I wrote about Ultra Petroleum (NYSE:UPL) and Antero Resources (NYSE:AR) earlier this year, but that was before the big price crash in August. One of the attractive features for AR earlier this year was its massive hedges that go well into the future.
I'm still a big fan of AR. However, with prices as low as they are now, the downside for some of the other producers is now more limited than it was in early 2015. For that reason, I prefer to focus a bit more on some other names in the sector.
There are a few companies I like, but Range Resources (NYSE:RRC) is right up towards the top of the list.
A Low-Cost Producer that is Becoming More Efficient
There's been much fuss made over falling natural gas prices and high supply, but I feel as if the reasons for both of these trends are often missed. Falling gas prices are a result of both technological improvements and economies of scale. The more gas America produces, the cheaper it becomes to produce. This is because overhead and marketing costs are still a significant component of per unit costs. Range Resources exemplifies that trend quite nicely.
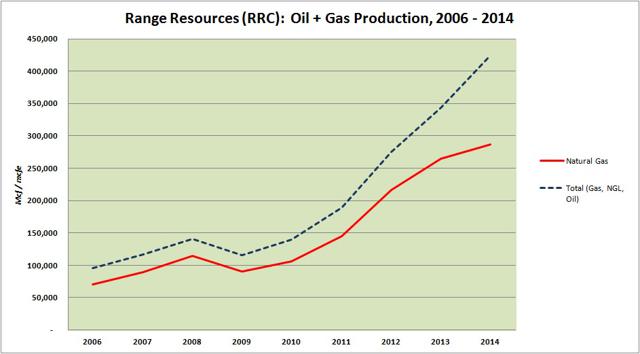
Range has increased production from 95 Bcfe in 2006 to 424 Bcfe in 2014. That's an increase of almost 350%.
Click on picture to enlarge
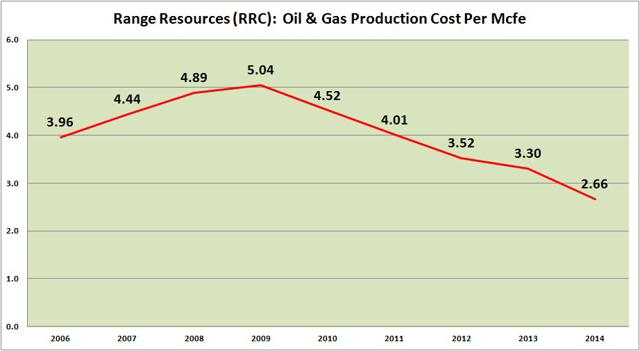
The more it has produced, the less expensive each unit of production has become. RRC's all-in production cost per Mcfe has fallen from $5.04 in 2009 down to $2.66 in 2014.
Click on picture to enlarge
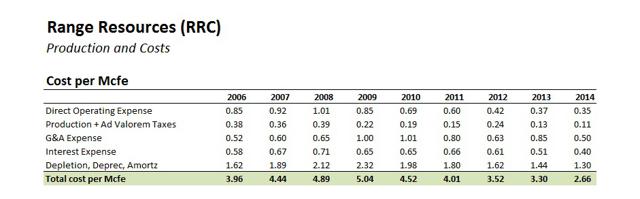
You can get a better sense of this by seeing the breakdown of costs. G&A expenses were highest in 2009 and 2010 after RRC had to cut production from 2008 levels. Direct operating expenses have fallen significantly since 2008, dropping from $1.01 down to $0.35 in 2014. Depletion has been lower as well, suggesting that RRC is getting more bang for the buck over time, too.
Click on picture to enlarge
This insight also explains why Antero Resources, another company operating in the natural gas E&P sphere, plans to dramatically ramp up production over the next several years. Moreover, this trend shows why it's a bit foolhardy to try to gamble on natural gas prices going up right now.
It's much more prudent to buy into producers rather than buying into the underlying commodity. By buying into the low-cost producers, you can benefit both from price improvements and volume gains, whereas betting on natural gas itself is simply a bet on prices moving significantly higher. This is perhaps a decent near-term bet, but perhaps more questionable over the long-term as companies continue to become more cost efficient.
Income Improvement Driven Mostly By Volume
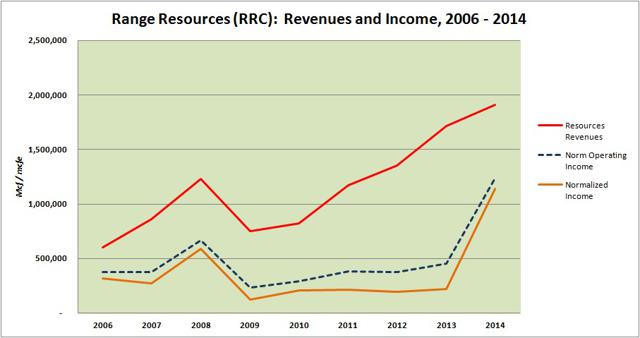
Range Resources has seen its income grow considerably in spite of persistently low natural gas prices. It has mostly improved income via volume gains. You can see that pretty clearly in the chart below where revenue gains are the main driver of improved Operating Income and "Normalized Income Before Taxes."
Click on picture to enlarge
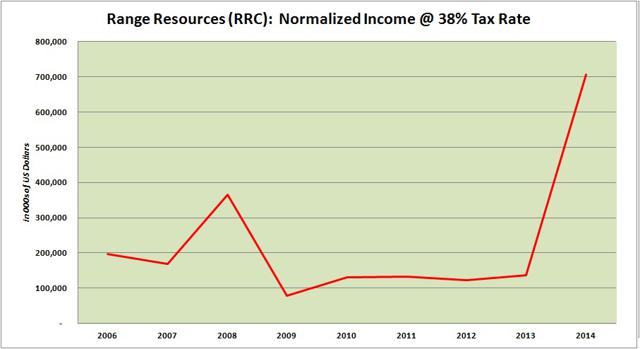
The best measure of RRC's profits in my view is Normalized Income. Note that in the chart above, the "Normalized Income" metric is before taxes. In the chart below, you can see normalized income using a 38% tax rate. Based on this, RRC's normalized income hovered in the $120 - $140 million range from 2010 - 2013, before skyrocketing up to $706 million in 2014.
Click on picture to enlarge
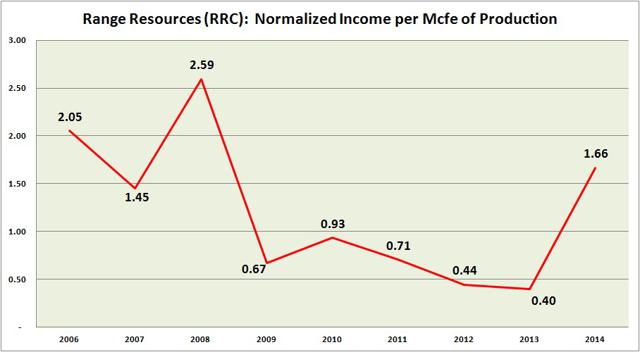
The big gains in 2014 were mostly the result of price increases that year, as well as volume gains, particularly in NGLs. One way to visualize the price gains is to look at normalized income per Mcfe or production. On that metric, RRC saw a slow decline from $0.93 of profit per Mcfe in 2010 down to $0.40 per Mcfe in 2013, before a huge jump to $1.66 per Mcfe in 2014.
Click on picture to enlarge
While RRC's income figures, cost efficiency, and production growth all look impressive, the one big downside is free cash flows. Due to large capital expenditure requirements, free cash flows have been mostly negative over the past four years.
Click on picture to enlarge
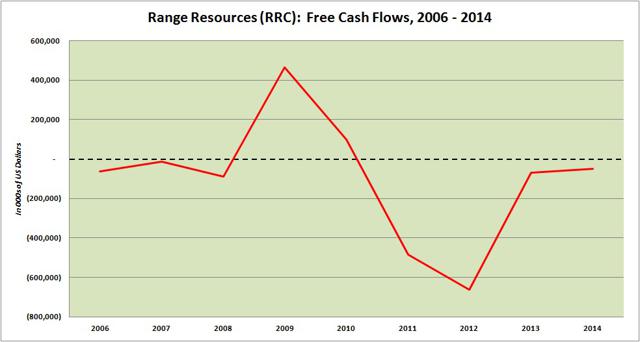
While I never like to see negative free cash flows, it's at least understandable in the context of rapid increases in production growth, which have helped RRC achieve greater cost efficiencies.
Historic Spreads
Let's take a look at RRC's spreads, as well. The chart below takes a bit of explaining, but here it goes. It examines prices versus production costs. We already looked at production costs earlier. This chart looks at three different prices.
The first is "Realized Price #1" which examines realized prices including accounting for derivatives. The second is "Realized Price #2" which looks at realized prices including derivative settlements and third party transport. I would view this as the most reliable metric. The third measure merely looks at wellhead prices (as opposed to realized prices).
Click on picture to enlarge
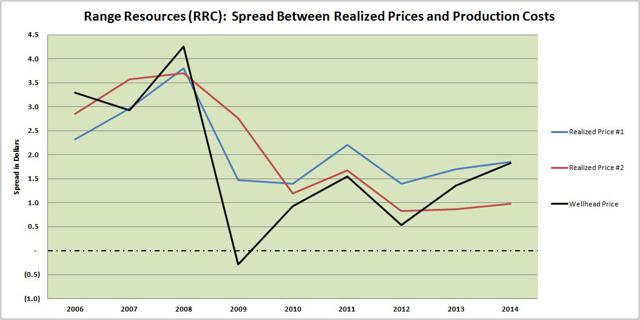
Using "Realized Price #2", the most important of the three metrics in my view, you can see that RRC has generated spreads typically in the range of $0.80 - $4.00 per Mcfe. They have been on the lower end of that spectrum since 2012, with a spread of 83 cents in 2012, 86 cents in 2013, and 98 cents in 2014.
Near-Term Issues
As natural gas prices have plunged, Range Resources has shifted into the red, producing a net loss in FY 2015 around negative $90 million. Yet, from a long-term perspective, this isn't the worst result. As mentioned, RRC is one of the lowest cost producers of natural gas. If RRC can't turn a profit, then it's unlikely that there are too many companies that can. This means that if the situation persists for any significant time, we're likely to see production cuts.
It's also worth noting that even in this bad environment, RRC still has positive operating cash flows. In the first half of 2015, RRC produced $370 million in cash flows from operations, compared to $442 million in the same period in 2014.
Range's biggest issue is capex. For the first half of 2015, RRC had about $720 million in capital expenditures. Based on financial statements I've observed, this is fairly commonplace in the industry right now. I'd wager to guess that capex will be the first thing to get cut back in a sustained low-price environment. Production cuts will be next. Based on this, I think it's possible that we could be in for 12 to 24 months of depressed pricing, but at some point, as demand continues to increase, production in the industry gets cut back, and capital expenditures are significantly reduced, we'll see a return to normalcy and higher spreads.
For this reason, this is certainly not a thesis for short-term investors. It could take 2, 5, or even 8 years before this investment really pays off, but these are exactly the type of risk-reward plays I view as the most profitable for investors who are patients and are willing not to panic at the first sign of bad news in the short-run.
Valuation Scenarios
In investment, it's important to get a sense of the "range of valuations" than it is to try to create one "precise" valuation in my view. In reality, the market is going to quickly adapt to different scenarios and you should have a sense of how a stock should be priced under all the different things that could occur. This is true with any equity investment, but doubly-true in the commodity sphere where prices can dramatically swing back and forth, causing even more dramatic shifts in the stock prices of the producers.
With natural gas E&Ps, one of the simpler approaches to valuation is to assign a multiple to proved reserves. That's exactly what I did with RRC. You can see a simple analysis of a range of valuation scenarios below.
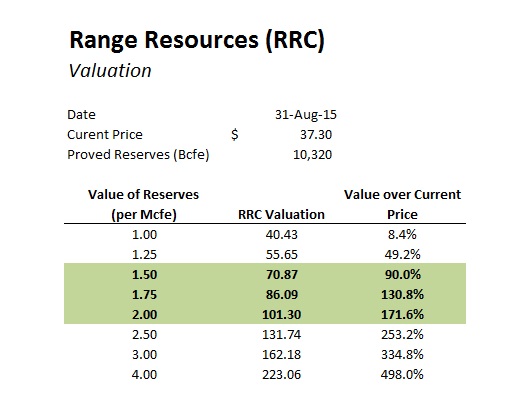
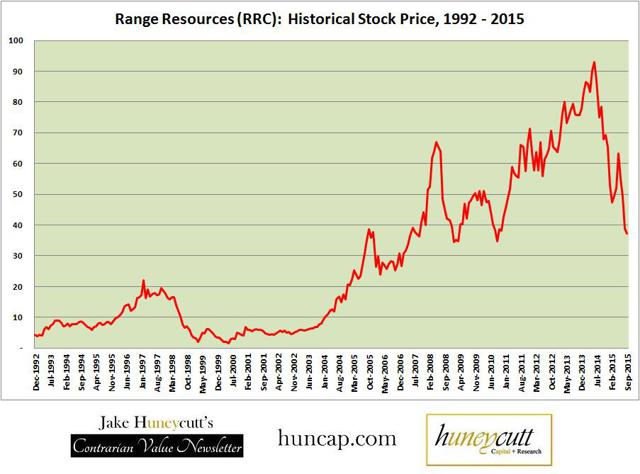
Currently, RRC's stock sells at about $37, which means it's priced at $0.95 per Mcfe of proved reserves. This seems extremely low to me. Remember, that historically, a spread of 100 bps is on the low end of things and RRC generated a profit of about $1.66 per Mcfe or production in FY 2014. Might also be worth mentioning that at the current price, RRC sells near the same price as it did at the bottom of the 2008 - 09 Financial Crisis, in spite of having production four times greater.
Click on picture to enlarge
There may be limited downside for long-term investors at the current stock price of $37. Even using the most historically depressed figures of around $0.80 per Mcfe, RRC is still worth $27. Assuming that natural gas prices rise again at some point and we see valuations closer to $1.50 - $2.00 per Mcfe, then RRC is worth in the range of $70 - $100; considerably higher than the current stock price of $37. In an upside scenario, where we enter another natural gas bull market, it would not be shocking to see RRC's stock price fly above $160.
Conclusions
Range Resources looks like a considerable value here for long-term investors. Mind you, this is not a stock for the "weak of will" or anyone that needs liquidity in the near-term. It's completely plausible that oil and gas prices fall further in the short term and RRC's stock dives below $25. Yet, for long-term investors who are willing to stick it out, RRC looks like a superior risk-reward play.
There are several macro tailwinds that could benefit the natural gas sector. Moreover, being in the midst of a 7 year natural gas bear market, it's hardly outside of the realm of possibility that we'll see another bull market in the next 5 - 8 years with higher realized spreads. In a bull market scenario, RRC would very likely sell at a price that is at least 3 times what it sells at now (and that's being conservative).
Overall, RRC and many other companies in the natural gas E&P sphere are excellent buys right now. Just be willing to have some patience, because it could conceivably take 3 - 8 years before the thesis to play out.
Disclosure: Author is long UPL, RRC, AR, and COG.


