
QT: Liquidity Drain
With the markets breaking out to new highs, it is not surprising to see a continued stream of analysis grappling for bits of data to support the bullish mantra. As you know, I have increased equity allocations in models with the breakout, but this is a tactical position only as the fundamentals simply do not support the rising risk levels currently.
However, despite 8-years of a bull market advance, one of the prevailing myths that seeming will not die is that of “cash on the sidelines.” To wit:
“Underpinning gains in both stocks and bonds is $5 trillion of capital that is sitting on the sidelines and serving as a reservoir for buying on weakness. This excess cash acts as a backstop for financial assets, both bonds and equities, because any correction is quickly reversed by investors deploying their excess cash to buy the dip,” Nikolaos Panigirtzoglou, the managing director of global market strategy at JPMorgan, wrote in a client note.
This is the age old excuse why the current “bull market” rally is set to continue into the indefinite future. The ongoing belief is that at any moment investors are suddenly going to empty bank accounts and pour it into the markets. However, the reality is if they haven’t done it by now after 3-consecutive rounds of Q.E. in the U.S., a 200% advance in the markets, and ongoing global Q.E., exactly what will that catalyst be?
However, Clifford Asness previously wrote:
“There are no sidelines. Those saying this seem to envision a seller of stocks moving her money to cash and awaiting a chance to return. But they always ignore that this seller sold to somebody, who presumably moved a precisely equal amount of cash off the sidelines.”
Every transaction in the market requires both a buyer and a seller with the only differentiating factor being at what PRICE the transaction occurs. Since this must be the case for there to be equilibrium to the markets there can be no “sidelines.”
Furthermore, despite this very salient point, a look at the stock-to-cash ratios also suggest there is very little available buying power for investors current.
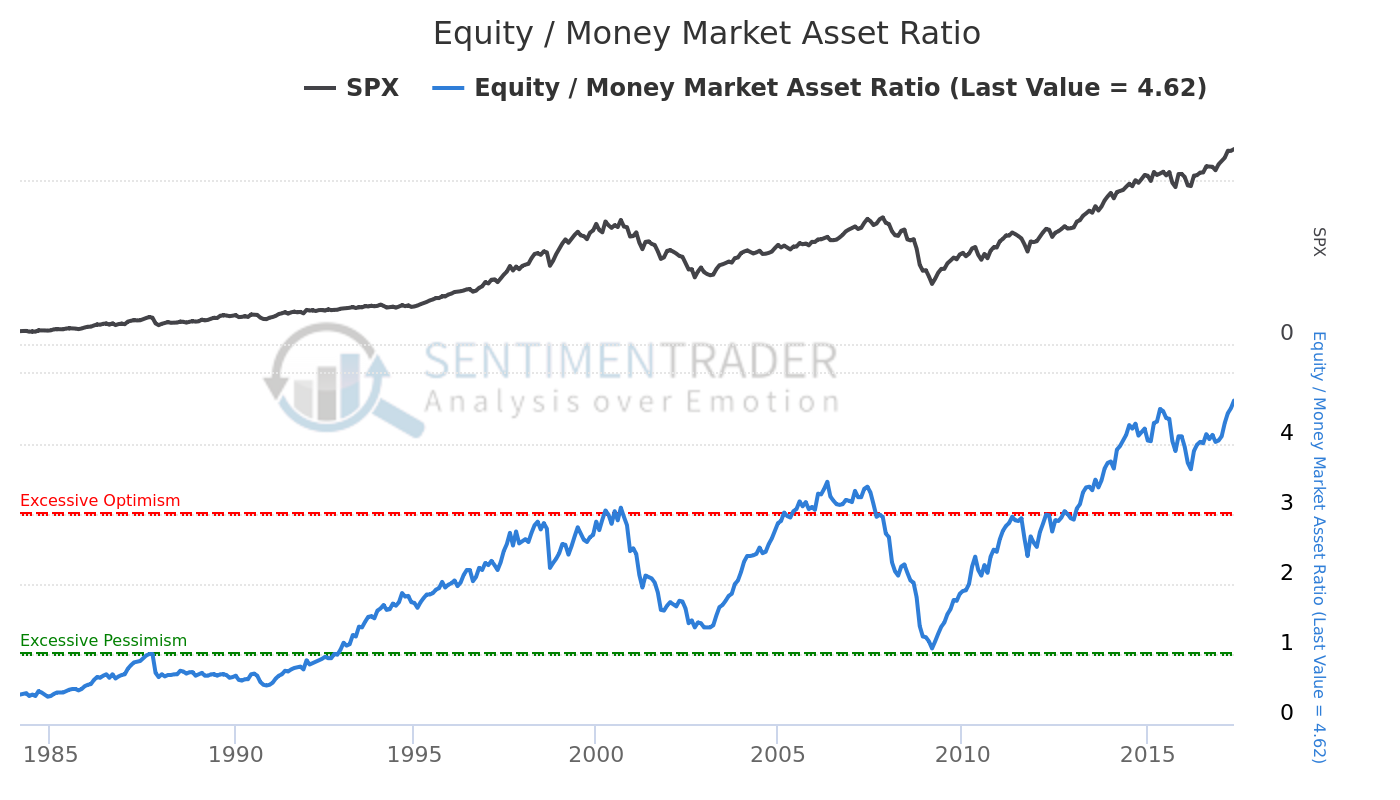
Each month, the Investment Company Institute releases information related to the mutual fund industry. Included in this data is the total amount of assets invested in mutual funds, ETFs and money market funds. As a rough measure of investor sentiment, this indicator looks at the total assets invested in equity mutual funds and ETFs, and compares it to the total assets invested in the safety of money market funds.
The higher the ratio, the more comfortable investors have become holding stocks; the lower the ratio, the more uncertainty there is in the market. Currently, with the ratio at the highest level on record there is little fear of holding stocks.
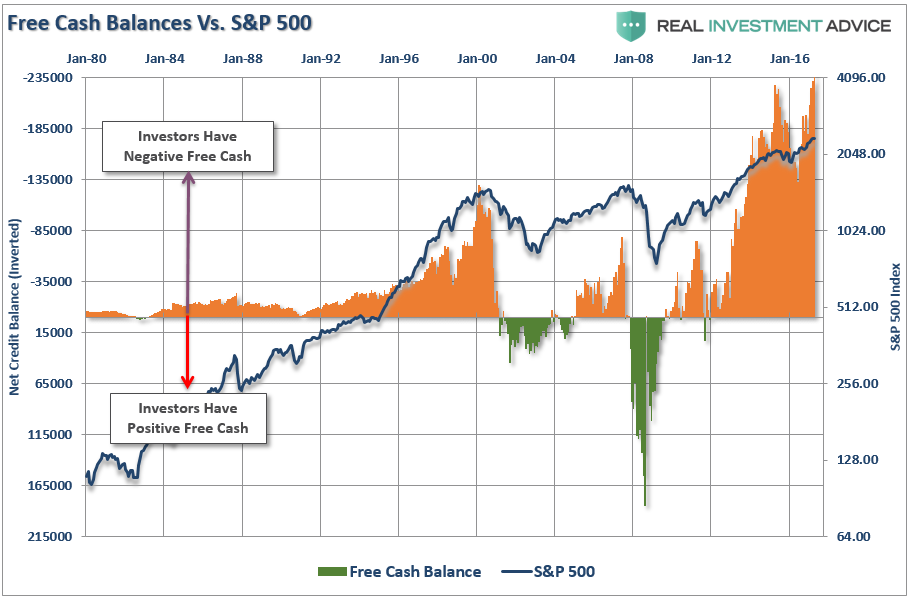
Negative free cash balances also suggest the same as investors have piled on the highest levels of leverage in market history.
Furthermore, with investors once again “fully invested” in equities, it is not surprising to see cash and bond allocations near historic lows.

Cash on the sidelines? Not really.
Everyone “all in the boat?” Absolutely.
Historical outcomes from such situations? Not Great.
Disclosure: The information contained in this article should not be construed as financial or investment advice on any subject matter. Streettalk Advisors, LLC expressly disclaims all liability in ...
more


Thanks