
Oil Prices Stubbornly Hold July Range Following Failed Breakout
OIL TALKING POINTS
Crude is back under pressure after attempting to break out of its recent range, with energy prices at risk of exhibiting a more bearish behavior over the days ahead as oil appears to be on its carves a fresh series of lower highs & lows.
OIL PRICES STUBBORNLY HOLD JULY RANGE FOLLOWING FAILED BREAKOUT

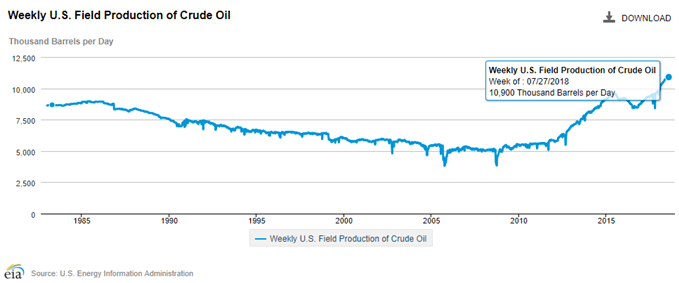
Growing tensions between the United States and China paired with signs of larger-than-anticipated supply appear to be dragging on oil, and the fresh updates from the U.S. Energy Information Administration (EIA) may keep a lid on energy prices as crude inventories unexpectedly climb 3803K in the week ending July 27 even as field outputs slowed for the first time since February.
Keep in mind, the Organization of the Petroleum Exporting Countries (OPEC) and its allies may continue to operate below full-capacity amid the broader expansion in U.S. production, and the group may regulate crude production beyond 2018 in order to rebalance the energy market. With that said, supply-side adjustments may keep oil prices afloat, and the broader outlook for crude remains constructive for now as both price and the Relative Strength Index (RSI) retain the upward trends from earlier this year.
However, recent price action raises the risk for further losses as crude carve a fresh string of lower highs & lows, with oil at risk of facing a critical test as it comes up against trendline support. Failure to preserve the bullish structure may highlight a material shift in oil price behavior especially if the RSI highlights a similar dynamic.
OIL DAILY CHART
(Click on image to enlarge)
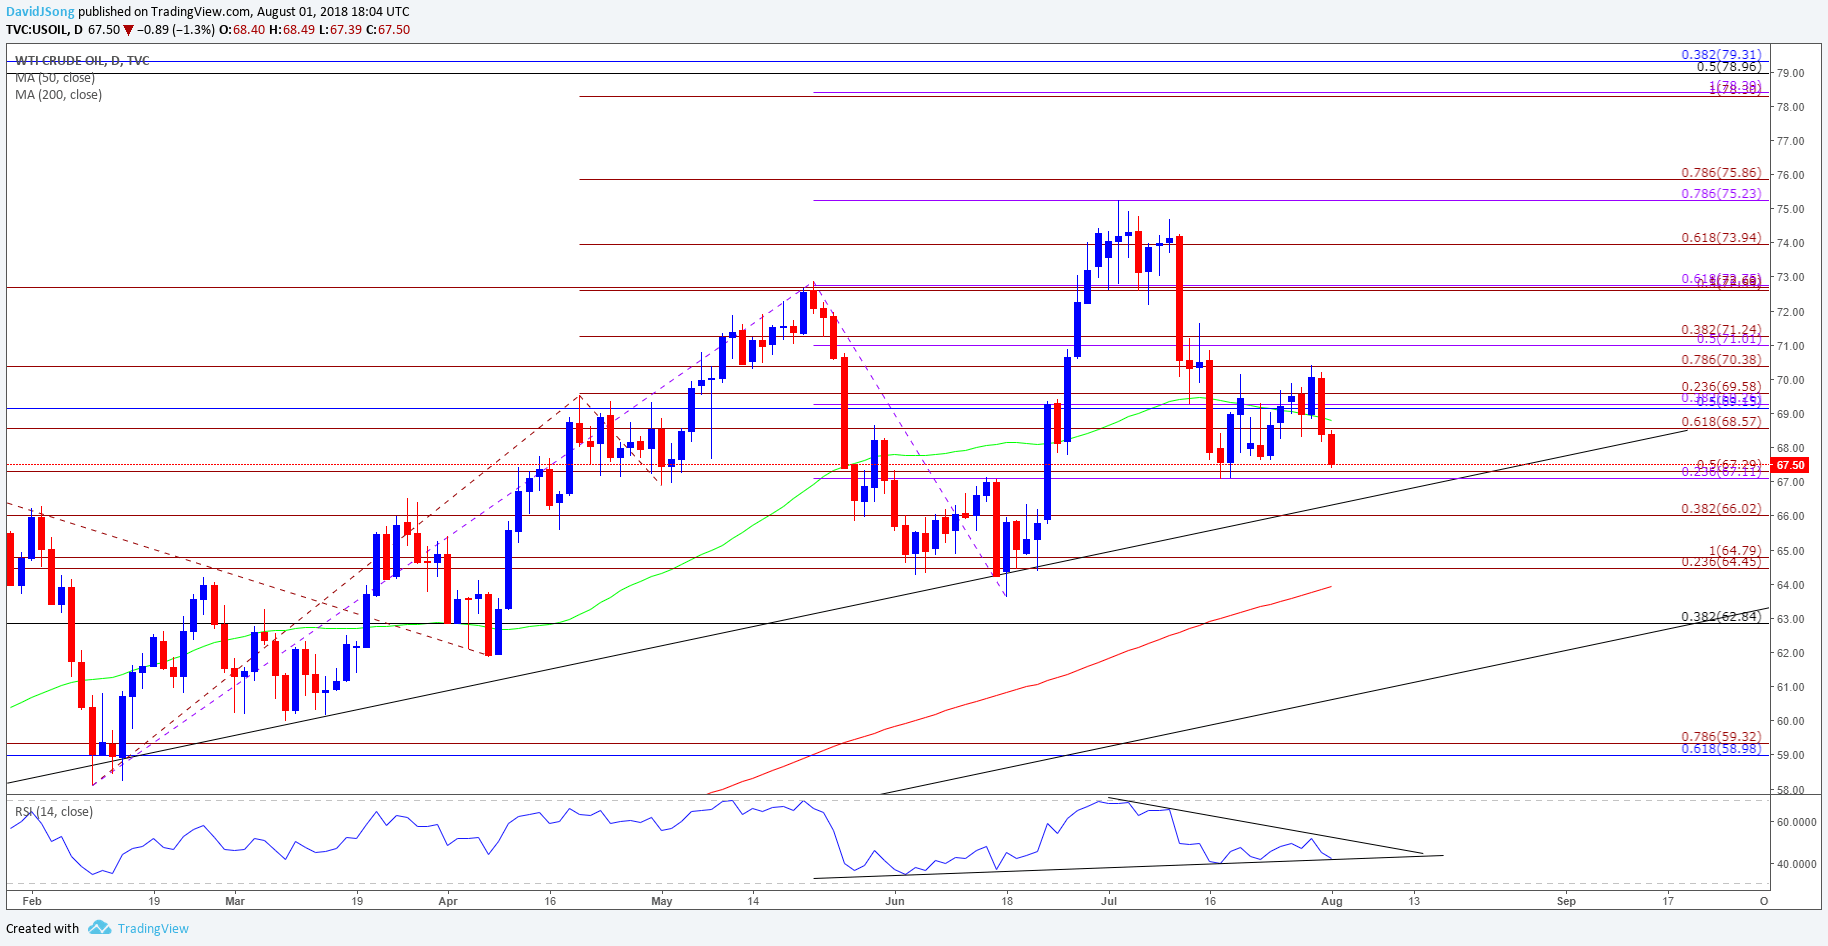
- Failure to break/close above the $70.40 (78.6% expansion) keeps last month’s range on the radar, with oil prices at risk of test the July-low ($67.08) as it initiates a bearish sequence.
- Need a break/close below the $67.10 (23.6% expansion) to $67.30 (50% expansion) region to open up the downside targets, with the next region of interest coming in around the $66.00 (38.2% expansion) handle followed by the Fibonacci overlap around $64.50 (23.6% expansion) to $64.80 (100% expansion).
Disclosure: Do you want to see how retail traders are currently trading the US Dollar? Check out our IG Client Sentiment ...
more

