Oil Prices Snap Bearish Sequence, OPEC Sees Rebalanced Energy Market
(Click on image to enlarge)
![]()
Crude snaps a three-day losing streak as the Organization of the Petroleum Exporting Countries (OPEC) insists the energy market will be rebalance in 2018.
OPEC’s Monthly Oil Market Report appears to be grabbing market attention as United Arab Emirates Energy Minister Suhail Al Mazrouei , the group’s current president, argues the pickup in shale output will not be ‘a huge distorter of the market’ even as U.S. production hits record-highs.
Efforts by OPEC and its allies to curb supply are likely to keep oil prices afloat as ‘demand for this year is expected to be good, if not better than 2017,’ but a further pickup in Non-OPEC production may drag on oil prices especially as the U.S. Energy Information Administration’s (EIA) warns ‘the United States is projected to become a net energy exporter by 2022.’
(Click on image to enlarge)
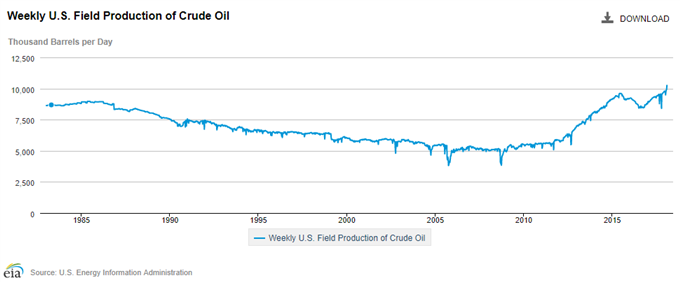
As a result, market participants may pay greater attention to U.S. field outputs rather than the weekly updates to the oil inventory figures, and OPEC and its allies may ultimately come under pressure to extend its rebalancing efforts beyond this year as ‘U.S. crude oil production in 2018 is projected to surpass the record of 9.6 million barrels per day (b/d) set in 1970 and will continue to grow as upstream producers increase output because of the combined effects of rising prices and production cost reductions.’
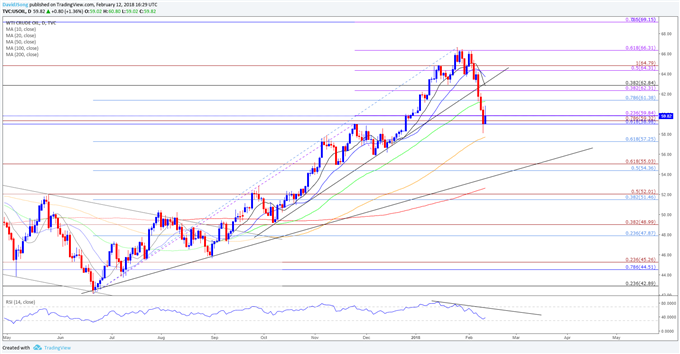
USOIL Daily Chart
(Click on image to enlarge)
Interested in trading? Review the ‘Traits of a Successful Trader’ series on how to effectively use leverage along with other best practices that any trader can follow.
- Broader outlook for crude is clouded with mixed signals as the Relative Strength Index (RSI) tracks the bearish formation from earlier this year.
- Nevertheless, the near-term outlook for USOIL has perked up as it halts the series of lower highs & lows from earlier this month, while the Relative Strength Index (RSI) appears to be reversing course ahead of oversold territory.
- Lack of momentum to test the 100-Day SMA (57.68) along with the failed attempts to close below the 59.00 (61.8% retracement) handle may bring the topside targets back on the radar, with the first hurdle coming in around 61.40 (78.6% retracement) followed by the former-support zone around 62.30 (38.2% expansion) to 62.80 (38.2% retracement).
![]()
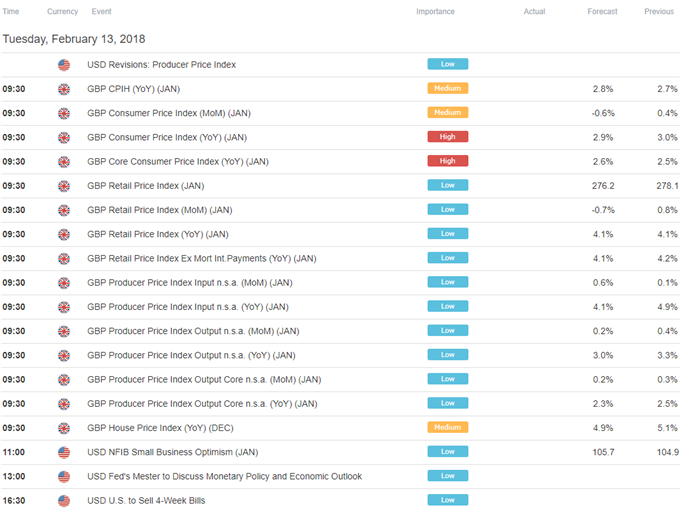
GBP/USD struggles to hold its ground even as Bank of England (BoE) board member Gertjan Vlieghe strikes a hawkish outlook for monetary policy, and the pair may continue to consolidate over the days ahead as the U.K. Consumer Price Index (CPI) is expected to highlight a mixed outlook for inflation.
Even though BoE Chief Economist Andrew Haldane notes that the central bank is in no rush to normalize monetary policy, Mr. Vlieghe warned against a ‘long break’ and went onto say that ‘further rises in rates are likely to be appropriate’ as inflation continues to run above the 2% target.
In turn, market participants may closely watch the fresh updates to the U.K. CPI, with a downtick in the headline reading likely to keep GBP/USD under pressure as it saps bets for an imminent BoE rate-hike. However, signs of sticky price growth may spark a bullish reaction in the British Pound as its puts pressure on Governor Mark Carney and Co. to implement higher borrowing-costs sooner rather than later.
(Click on image to enlarge)
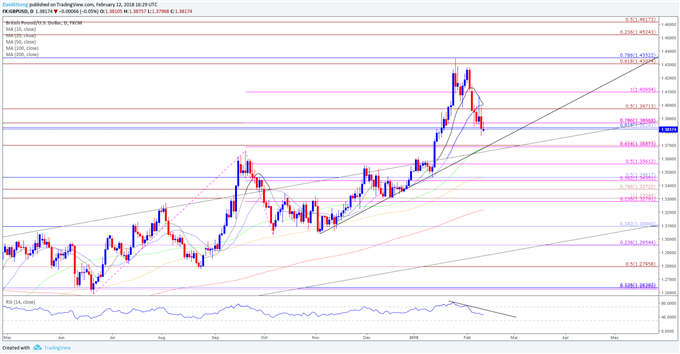
- Near-term outlook for GBP/USD remains capped by the 1.3970 (50% expansion) region, with the downside targets still on the radar as the pair carves a fresh series of lower-highs, while the Relative Strength Index (RSI) continues to track the bearish formation from earlier this year.
- The former-resistance zone around 1.3690 (61.8% expansion) to 1.3700 (38.2% expansion) is in focus as it largely lines up with trendline support; next downside hurdle coming in around 1.3560 (50% expansion) followed by the Fibonacci overlap around 1.3440 (38.2% expansion) to 1.3460 (50% retracement).
(Click on image to enlarge)