
Oil Market Chaos Continues
ValuEngine tracks more than 7000 US equities, ADRs, and foreign stock which trade on US exchanges as well as @1000 Canadian equities. When EPS estimates are available for a given equity, our model calculates a level of mispricing or valuation percentage for that equity based on earnings estimates and what the stock should be worth if the market were totally rational and efficient--an academic exercise to be sure, but one which allows for useful comparisons between equities, sectors, and industries. Using our Valuation Model, we can currently assign a VE valuation calculation to more than 2800 stocks in our US Universe.
Market volatility has returned with a vengeance so far this year. The stock market has gone into a tailspin driven by a Chinese stock-market sell off and economic slow down, carnage in the oil markets, and the resultant uncertainty about the global economy.
Oil prices are in the gutter thanks to a big over supply and lower demand. Crude has now gone lower than $30/barrel for the first time in twelve years, and investors are watching that per barrel price very carefully. Other commodities are also suffering from price declines--and this adds further uncertainty about the global economy. But, the oil price so far this year has been closely correlated to stock prices.
Lower energy prices have been a boon to US consumers still tied to their automobiles, the trucking industry, auto manufacturers, airlines, and other companies sensitive to the price of refined crude. But, if the declining oil price is indicative of a global slow-down (eg a demand problem) then this will catch up with those industries sooner or later.
Obviously, if you are looking to buy low, oil stocks in most industries within the sector have declined significantly along with the price of crude. Oil is currently near its multi-year low. So, if you're looking for cheap energy/oil stocks, now may be the time. For today's bulletin we queried our systems for the various oil-related industries in the Energy Sector. We find the following data for top-five lists in various categories.
Top-Five Oil Industry Stocks--Short-Term Forecast Returns
|
Ticker |
Name |
Mkt Price |
Valuation (%) |
VE Rating |
Last 12-M Return (%) |
|
CVR REFINING LP |
17.38 |
-20.13% |
5 |
20.69% |
|
|
TESORO CORP |
90.73 |
-21.12% |
5 |
18.51% |
|
|
NORTHERN TIER |
25.32 |
-5.19% |
5 |
24.00% |
|
|
ALON USA PTNRS |
19.04 |
-2.47% |
5 |
47.25% |
|
|
VALERO ENERGY |
67.86 |
-6.02% |
5 |
41.38% |
Top-Five Oil Industry Stocks--Most Undervalued
|
Ticker |
Name |
Mkt Price |
Valuation (%) |
VE Rating |
Last 12-M Return (%) |
|
ATWOOD OCEANICS |
6.07 |
-75.00% |
3 |
-79.44% |
|
|
CONTANGO OIL&GS |
4.77 |
-75.00% |
2 |
-82.96% |
|
|
COBALT INTL EGY |
3.25 |
-75.00% |
2 |
-60.89% |
|
|
AROC |
ARCHROCK INC |
5.7 |
-73.63% |
2 |
-79.78% |
|
ENERGY TRAN EQT |
9.63 |
-71.92% |
3 |
-64.33% |
Top-Five Consumer Staples Stocks--Most Overvalued
|
Ticker |
Name |
Mkt Price |
Valuation (%) |
VE Rating |
Last 12-M Return (%) |
|
SOUTHWESTRN ENE |
8.77 |
157.65% |
2 |
-65.63% |
|
|
GULFMARK OFFSHR |
3.11 |
124.21% |
1 |
-85.25% |
|
|
CARBO CERAMICS |
16.48 |
80.53% |
1 |
-51.43% |
|
|
SYNERGY RES CP |
5.85 |
66.69% |
2 |
-50.09% |
|
|
EQT CORP |
58.04 |
58.87% |
2 |
-23.49% |
Top-Five Consumer Staples Stocks--Composite Score
|
Ticker |
Name |
Mkt Price |
Valuation (%) |
VE Rating |
Last 12-M Return (%) |
|
TESORO CORP |
90.73 |
-21.12% |
5 |
18.51% |
|
|
CVR REFINING LP |
17.38 |
-20.13% |
5 |
20.69% |
|
|
VALERO ENERGY |
67.86 |
-6.02% |
5 |
41.38% |
|
|
MARATHON PETROL |
42.83 |
-16.77% |
5 |
2.01% |
|
|
HOLLYFRONTIER |
36.15 |
-9.01% |
5 |
9.75% |
Top-Five Consumer Staples Stocks--Momentum
|
Ticker |
Name |
Mkt Price |
Valuation (%) |
VE Rating |
Last 12-M Return (%) |
|
ALDW |
ALON USA PTNRS |
19.04 |
-2.47% |
5 |
47.25% |
|
VLO |
VALERO ENERGY |
67.86 |
-6.02% |
5 |
41.38% |
|
CAM |
CAMERON INTL |
60.58 |
10.23% |
4 |
36.50% |
|
PBF |
PBF ENERGY INC |
35.54 |
-2.58% |
5 |
34.01% |
|
NTI |
NORTHERN TIER |
25.32 |
-5.19% |
5 |
24.00% |
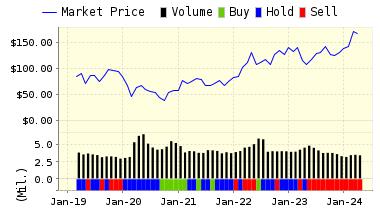
Below is today's data on Valero Energy (VLO):
Valero Energy Corporation owns and operates refineries in the United States and Canada with a combined throughput capacity of approximately two million BPD, making it one of the nation's top refiners of petroleum products. Valero is also one of the nation's leading retail operators with retail outlets in the United States and Canada under various brand names including Diamond Shamrock, Ultramar, Valero, Beacon and Total.
ValuEngine continues its STRONG BUY recommendation on VALERO ENERGY for 2016-01-22. Based on the information we have gathered and our resulting research, we feel that VALERO ENERGY has the probability to OUTPERFORM average market performance for the next year. The company exhibits ATTRACTIVE Company Size and Momentum.
|
ValuEngine Forecast |
||
|
Target |
Expected |
|
|---|---|---|
|
1-Month |
68.87 | 1.50% |
|
3-Month |
70.57 | 4.00% |
|
6-Month |
73.10 | 7.72% |
|
1-Year |
80.14 | 18.10% |
|
2-Year |
78.89 | 16.25% |
|
3-Year |
79.61 | 17.32% |
|
Valuation & Rankings |
|||
|
Valuation |
6.02% undervalued |
Valuation Rank(?) |
|
|
1-M Forecast Return |
1.50% |
1-M Forecast Return Rank |
|
|
12-M Return |
41.38% |
Momentum Rank(?) |
|
|
Sharpe Ratio |
0.63 |
Sharpe Ratio Rank(?) |
|
|
5-Y Avg Annual Return |
22.36% |
5-Y Avg Annual Rtn Rank |
|
|
Volatility |
35.61% |
Volatility Rank(?) |
|
|
Expected EPS Growth |
-13.90% |
EPS Growth Rank(?) |
|
|
Market Cap (billions) |
34.90 |
Size Rank |
|
|
Trailing P/E Ratio |
7.73 |
Trailing P/E Rank(?) |
|
|
Forward P/E Ratio |
8.98 |
Forward P/E Ratio Rank |
|
|
PEG Ratio |
n/a |
PEG Ratio Rank |
|
|
Price/Sales |
0.36 |
Price/Sales Rank(?) |
|
|
Market/Book |
1.60 |
Market/Book Rank(?) |
|
|
Beta |
1.98 |
Beta Rank |
|
|
Alpha |
0.37 |
Alpha Rank |
|
ValuEngine Market Overview
|
Summary of VE Stock Universe |
|
|
Stocks Undervalued |
73.94% |
|
Stocks Overvalued |
26.06% |
|
Stocks Undervalued by 20% |
40.21% |
|
Stocks Overvalued by 20% |
8.13% |
ValuEngine Sector Overview
|
Sector |
Change |
MTD |
YTD |
Valuation |
Last 12-MReturn |
P/E Ratio |
|
1.68% |
-5.19% |
-5.19% |
1.44% undervalued |
-6.86% |
22.26 |
|
|
3.00% |
-5.32% |
-5.32% |
4.14% undervalued |
-14.24% |
21.45 |
|
|
2.07% |
-7.71% |
-6.41% |
8.05% undervalued |
-11.29% |
27.09 |
|
|
1.90% |
-7.17% |
-7.17% |
8.63% undervalued |
-13.81% |
22.18 |
|
|
1.54% |
-7.77% |
-7.77% |
9.20% undervalued |
-13.26% |
18.67 |
|
|
1.72% |
-7.96% |
-7.96% |
11.14% undervalued |
-10.02% |
14.85 |
|
|
1.78% |
-9.13% |
-9.13% |
11.63% undervalued |
-20.85% |
15.49 |
|
|
1.74% |
-10.76% |
-10.76% |
13.44% undervalued |
-15.05% |
26.44 |
|
|
1.56% |
-7.77% |
-7.77% |
13.72% undervalued |
-13.20% |
22.44 |
|
|
1.71% |
-8.82% |
-8.82% |
14.57% undervalued |
-14.39% |
16.42 |
|
|
1.80% |
-7.25% |
-7.25% |
14.65% undervalued |
-15.18% |
21.92 |
|
|
2.10% |
-9.49% |
-9.49% |
22.30% undervalued |
-15.35% |
17.31 |
|
|
1.20% |
-11.17% |
-11.17% |
23.31% undervalued |
-21.67% |
11.17 |
|
|
1.74% |
-11.09% |
-11.11% |
24.56% undervalued |
-32.48% |
21.32 |
|
|
5.59% |
-13.61% |
-13.61% |
25.82% undervalued |
-41.32% |
20.75 |
|
|
2.41% |
-11.00% |
-11.00% |
27.12% undervalued |
-32.48% |
12.25 |
ValuEngine.com is an independent research provider, producing buy/hold/sell recommendations, target price, and valuations on over 7,000 US and Canadian equities every trading day.
Disclosure: None.
Disclaimer: ValuEngine.com is an independent research provider, producing buy/hold/sell recommendations, ...
more

