
October 2018 Producer Price Final Demand Year-over-Year Inflation Grew
The Producer Price Index year-over-year inflation increased from 2.6 % to 2.9 %.

Analyst Opinion of Producer Prices
The Producer Price Index increased year-over-year. Food and energy prices were two of the major factors in this increase - and services inflation rose lead by trade services. The growth in inflation was more than expected. Here is what the BLS said in part:
Final demand services: The index for final demand services increased 0.7 percent in October, the largest advance since climbing 0.8 percent in January 2016. Nearly three-fourths of the broad-based October rise can be traced to margins for final demand trade services, which moved up 1.6 percent. (Trade indexes measure changes in margins received by wholesalers and retailers.) Prices for final demand services less trade, transportation, and warehousing and for final demand transportation and warehousing services increased 0.2 percent and 0.6 percent, respectively.
Product detail: About one-fifth of the October advance in prices for final demand services is attributable to a 1.2-percent rise in margins for machinery, equipment, parts, and supplies wholesaling. The indexes for food and alcohol retailing; health, beauty, and optical goods retailing; inpatient care; apparel, jewelry, footwear, and accessories retailing; and traveler accommodation services also moved higher. In contrast, prices for loan services (partial) fell 0.5 percent. The indexes for hospital outpatient care and furniture retailing also declined.
Final demand goods: The index for final demand goods climbed 0.6 percent in October, the largest rise since advancing 0.9 percent in May. Nearly three-fourths of the October increase can be traced to prices for final demand energy, which moved up 2.7 percent. The index for final demand foods rose 1.0 percent. Prices for final demand goods less foods and energy were unchanged.
Product detail: Over 60 percent of the October increase in prices for final demand goods is attributable to the gasoline index, which jumped 7.6 percent. Prices for diesel fuel, fresh and dry vegetables, beef and veal, cigarettes, and jet fuel also moved higher. Conversely, the motor vehicles index fell 0.7 percent. (In accordance with usual practice, most new-model-year passenger car and light motor trucks were introduced into the PPI in October.
The PPI represents inflation pressure (or lack thereof) that migrates into consumer price.
The market had been expecting (from Econoday):
| month over month change | Consensus Range | Consensus | Actual |
| PPI-Final Demand (PPI-FD) | 0.1 % to 0.4 % | +0.2 % | +0.6 % |
| PPI-FD less food & energy (core PPI) | 0.1 % to 0.3 % | +0.2 % | % |
| PPI-FD less food, energy & trade services | 0.1 % to 0.3 % | +0.2 % | +0.2 % |
The producer price inflation breakdown:
| category | month-over-month change | year-over-year change |
| final demand goods | +0.6 % | |
| final demand services | +0.7 % | |
| total final demand | -0.6 % | +2.9 % |
| processed goods for intermediate demand | +0.8 % | +5.9 % |
| unprocessed goods for intermediate demand | +3.6 % | +7.8 % |
| services for intermediate demand | +0.4 % | +3.2 % |

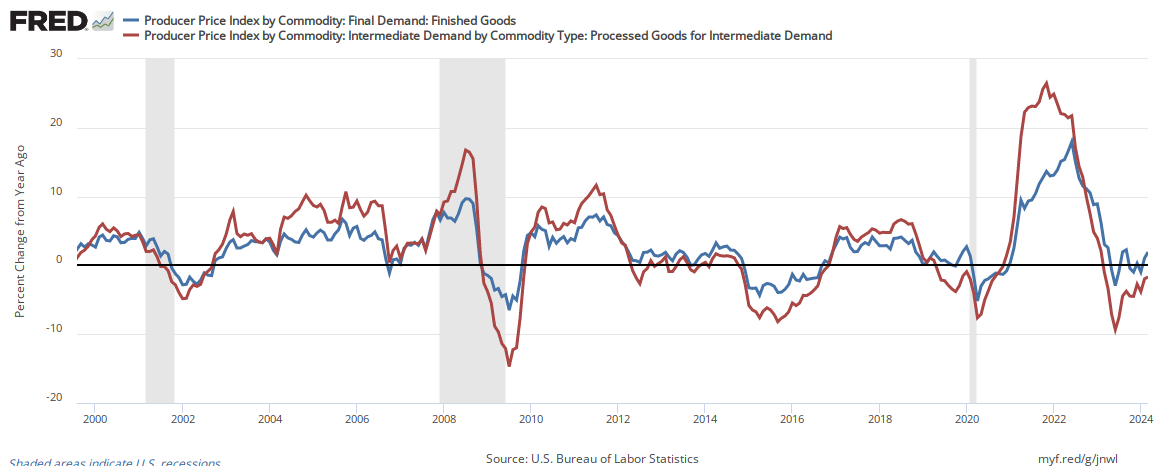
In the following graph, one can see the relationship between the year-over-year change in intermediate goods index and finished goods index. When the crude goods growth falls under finish goods - it usually drags finished goods lower.
Percent Change Year-over-Year - Comparing PPI Finished Goods (blue line) to PPI Intermediate Goods (red line)
Econintersect has shown how pricing change moves from the PPI to the Consumer Price Index (CPI).
Comparing Year-over-Year Change Between the PPI Finished Goods Index (blue line) and the CPI-U (red line)

The price moderation of the PPI began in September 2011 when the year-over-year inflation was 7.0%. Currently, inflation is on an increasing trend line.
Caveats on the Use of Producer Price Index
Econintersect has performed several tests on this series and finds it fairly representative of price changes (inflation). However, the headline rate is an average - and for an individual good or commodity, this series provides many sub-indices for specific application.
A very good primer on the Producer Price Index nuances can be found here.
Because of the nuances in determining the month-over-month index values, the year-over-year or annual change in the PPI index is preferred for comparisons.
There is moderate correlation between crude goods and finished goods. Higher crude material prices push the finished goods prices up.
Disclaimer: No content is to be construed as investment advise and all content is provided for informational purposes only.The reader is solely responsible for determining whether any investment, ...
more

