
NZD/USD Rate Outlook Mired By Bear-Flag Formation
NEW ZEALAND DOLLAR TALKING POINTS
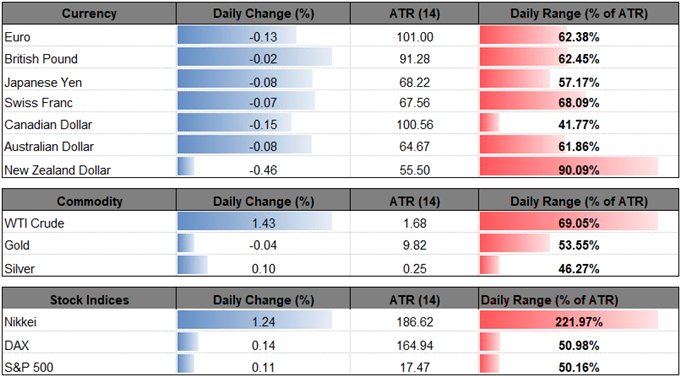
NZD/USD appears to be on track to test the May-low (0.6851) as it extends the series of lower highs & lows from the previous week, and the exchange rate may continue to give back the advance from late last year as a bear flag formation unfolds.
(Click on image to enlarge)
NZD/USD RATE OUTLOOK MIRED BY BEAR-FLAG FORMATION

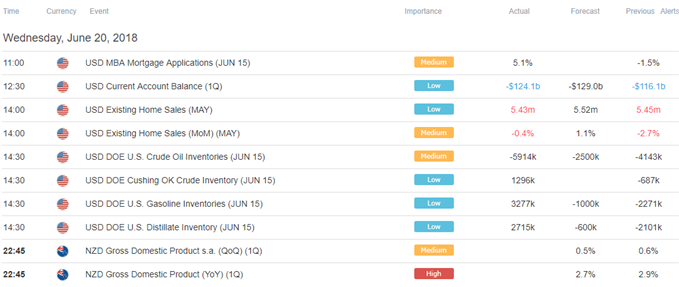
The New Zealand dollar struggles to hold its ground ahead of the Gross Domestic Product (GDP) report, which is anticipated to show the growth rate narrowing to an annualized 2.7% from 2.9% in the fourth-quarter of 2017, and the development may keep NZD/USD under pressure as it encourages the Reserve Bank of New Zealand (RBNZ) to keep the official cash rate (OCR) at the record-low throughout the remainder of the year.
With that said, the RBNZ may merely attempt to buy more time at the next meeting on June 28 as the central bank expects ‘to keep the OCR at this expansionary level for a considerable period of time,’ and Governor Adrian Orr & Co. may continue to promote a wait-and-see approach for monetary policy as ‘consumer price inflation remains below the 2 percent mid-point of our target due, in part, to recent low food and import price inflation, and subdued wage pressures.’
Moreover , the structural reforms at the RBNZ may further delay the hiking-cycle as the new Policy Target Agreement (PTA) ‘requires monetary policy to be conducted so that it contributes to supporting maximum levels of sustainable employment within the economy,’ and the central bank may continue to resist calls to implement higher borrowing-costs as ‘potential growth is expected to ease to below 3 percent as the growth rate of the labour force slows.’
In turn, NZD/USD remains vulnerable to further losses, with recent price action raising the risk for fresh 2018-lows as the bearish momentum from earlier this year appears to be gathering pace.
NZD/USD DAILY CHART
(Click on image to enlarge)

- Downside targets remain on the radar for NZD/USD as it carves a bearish series, while the Relative Strength Index (RSI) continues to track the downward trend from earlier this year, with the oscillator quickly approaching oversold territory.
- Break of the May-low (0.6851) brings the Fibonacci overlap around 0.6820 (23.6% retracement) to 0.6870 (78.6% expansion) into play, with the next downside region of interest coming in around 0.6780 (100% expansion), which lines up with the November-low (0.6780).
(Click on image to enlarge)
Disclosure: Do you want to see how retail traders are currently trading the US Dollar? Check out our IG Client Sentiment ...
more

