
'NYHL' Had A Divergence In 2000 And 2007; A Divergence Is Also Present In 2017
Bad Breadth Can Foreshadow Bear Markets
Market breadth speaks to the number of stocks participating in an advance. Strong market breadth means a high percentage of stocks are making new highs as the major indexes make new highs. Strong breadth also aligns with widespread confidence in stocks and the economy.
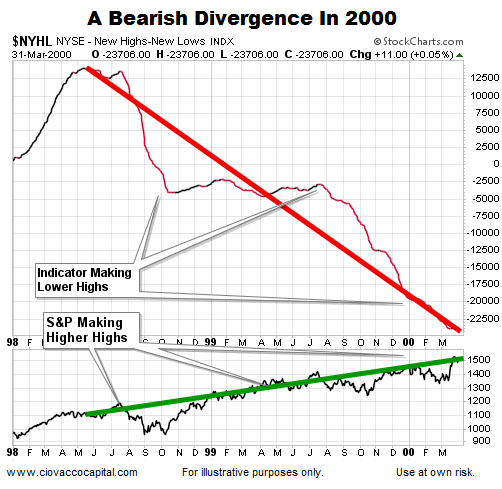
Bearish Divergence In 2000
The chart below tracks the number of NYSE stocks making new highs minus the number making new lows. A bearish divergence was clearly evident well before the bull market peaked in March 2000.
(Click on image to enlarge)
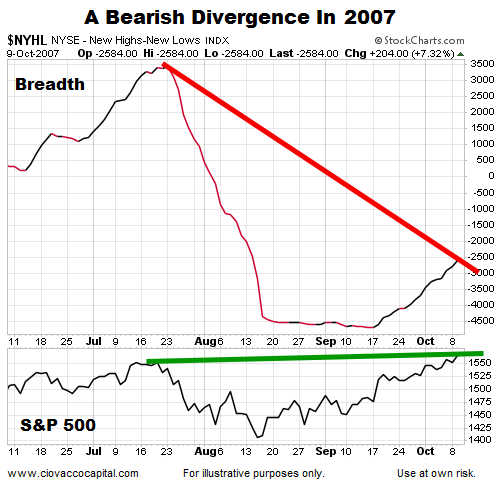
Bearish Divergence In 2007
NYSE New Highs - New Lows ($NYHL) also failed to confirm the S&P 500’s new high in October 2007, telling us many stocks were already showing signs of weakness before the major averages peaked.
(Click on image to enlarge)
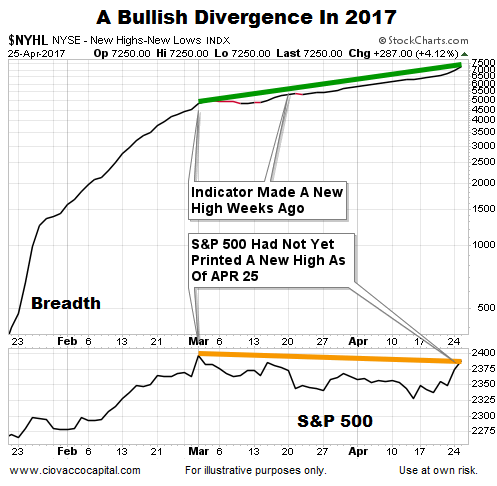
Bullish Divergence In 2017
How does breadth look as of April 25, 2017? Instead of a bearish divergence, $NYHL has a bullish divergence. The bullish divergence tells us the current rally has broad participation from both sector and market capitalization (small, mid, large cap) perspectives. Instead of waving yellow flags as it did in both 2000 and 2007, $NYHL is telling us to be open to new record highs in the major averages.
(Click on image to enlarge)
Like any chart or indicator, $NYHL helps us assess the probability of good things happening relative to the probability of bad things happening. The probability of bad things happening never drops to zero. Market breadth in 2017 leans toward the “good things happening” end of the spectrum looking out weeks, months, and years.
Disclosure: This post contains the current opinions of the author but not necessarily those of Ciovacco Capital Management. The opinions are subject to change ...
more

