Nine Years Vs. Nine Months Of Volatility: Reading The Signs
Despite last week’s pullback, 2018 has still been a positive year for many U.S. equity investors. If the S&P 500 Index closes positive this year, it will be its 10th consecutive positive year. A 10-year bull run has not happened since the 1950s. One significant way in which this bull market has manifested has been through lower volatility in equity markets.
However, as we head into the last quarter of the year, and looking ahead to 2019, many investors are asking whether there are telltale signs of a pickup in volatility. My analysis below tries to answer this very question and suggests some strategies to consider for an environment of rising volatility.
Nine-Year Decline vs. Nine-Month Pickup in Volatility
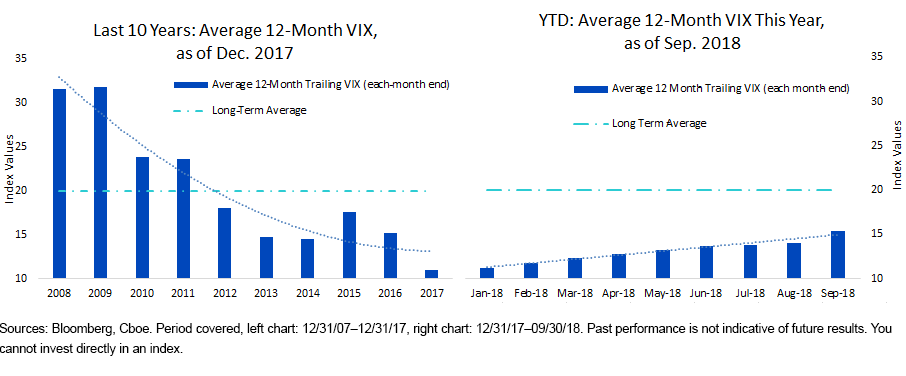
The U.S. Federal Reserve announced quantitative easing in February 2009. For the subsequent nine years, equities saw a massive run, along with a VIX that declined to an all-time low in 2017 (below, left). In contrast, the first nine months of 2018 have seen a consistent uptick in VIX numbers (below, right), though it remains below its long-term average. 2018 has seen some big jumps in volatility.

Will There Be a Further Pickup in Volatility?
I think the answer to this may lie with the VIX futures curve. Similar to the term-structure curves in relation to commodity futures, VIX can also have a futures curve, where different points on the curve suggest investors’ current expectations of implied volatilities at those times.
Under normal circumstances, as one moves further along the curve (into the future), the corresponding values should be higher. This is partly because a period of six months involves more uncertainty than one month. In other words, six months minus the one-month VIX futures spread is usually positive. Commodity traders refer to this upward sloping nature of a futures curve as being in “contango.” It implies a roll cost every month—which is why investor’s structurally long volatility-hedging products can face a strategic challenge.
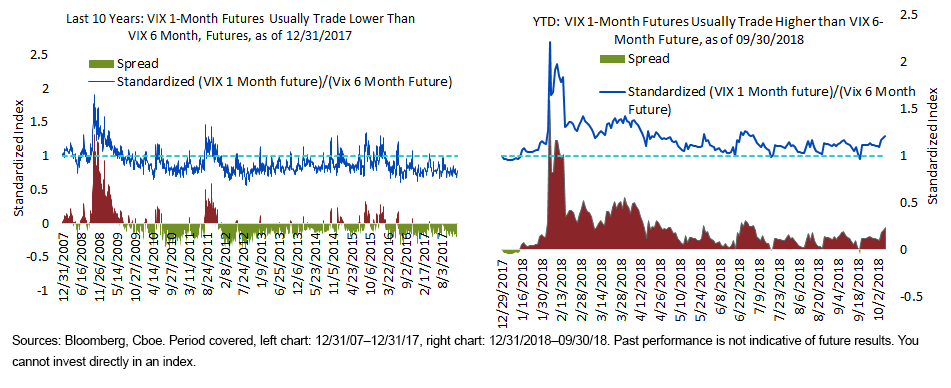
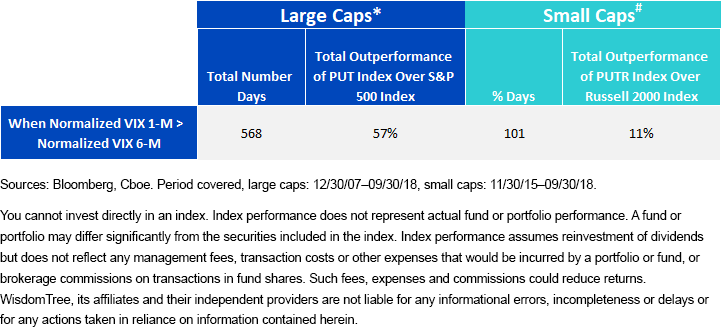
The chart on the left, below, shows a standardized series of VIX one-month and six-month futures contracts going back 10 years, as of December 2017. Out of approximately 2,600 trading days, there were about 568 days (slightly over 20%) when one-month VIX was higher than six-month VIX, or when near-term VIX surged above medium-term VIX (highlighted in red on the lower axis).
It happened during the financial crisis of 2008–09, during the Greek default and euro contagion in 2011, and during other stress periods. Thus, an acceleration in near-term over medium-term VIX is likely a signal of heightened volatility and possibly market corrections.
What can take investors by surprise is that, with an occurrence rate of over 20%, this kind of acceleration is not uncommon.
The chart on the right shows a year-to-date standardized series of VIX one-month and six-month futures contracts. In sharp contrast to the 10-year chart, the VIX one-month traded higher on 183 out of 195 days. To recap, there have been two reversals in VIX trends this year:
- The trailing 12-month average VIX is trending higher this year in contrast to the last nine years
- VIX 1-month futures are consistently trading higher this year

How Can You Seek to Protect Your Portfolio?
In 2016, WisdomTree launched its first option-selling strategy, the WisdomTree CBOE S&P 500 PutWrite Strategy Fund (PUTW), which tracks the Cboe S&P 500 PutWrite (Put) Index.
This cash-collateralized strategy sells at-the-money (ATM) monthly put options on the S&P 500 Index and collects premiums. By generating monthly income through selling put options, this strategy aims to offset losses in a declining market while still seeking positive returns during rising markets.
Given the popularity and track record of PUTW, we also launched a small-cap version of the strategy. The WisdomTree CBOE Russell 2000 PutWrite Strategy Fund (RPUT) tracks the Cboe Russell 2000 PutWrite Index (PUTR) and sells cash-collateralized monthly ATM options on the Russell 2000 Index.
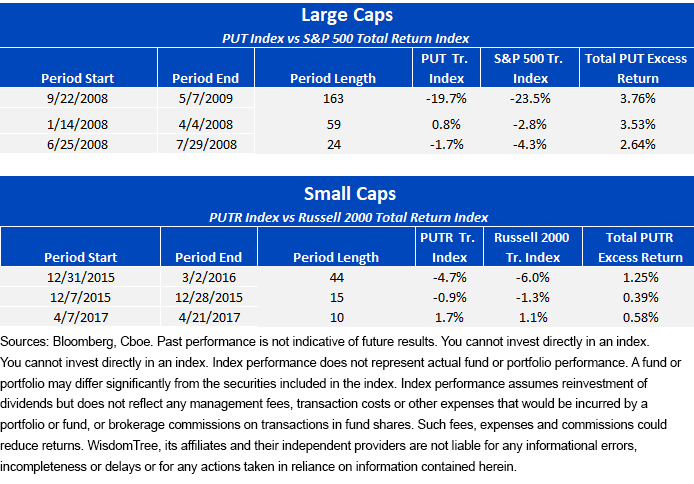
We highlight the cumulative outperformance of these option-selling strategy funds relative to their respective equity benchmarks during the periods discussed above, in which short-term volatility surged.

Taking it one step further, we also show the five longest periods in which VIX one-month futures constantly traded higher than VIX six-month futures, for both the large- and small-cap universes.

Conclusion
After a decade of low volatility, there are strong signs that the U.S. equity market could be entering a period of higher volatility. Even from a geopolitical perspective, there are risks ranging from rising rates to escalating trade tensions, which have the potential to disrupt the market’s growth.
Volatility-reducing strategies such as WisdomTree’s PUTW and RPUT can help investors stay the course without introducing the unique stock selection risk of other low-volatility investment strategies. By incorporating option strategies, investors can potentially outperform not only during periods of stress but also on a longer-term risk-adjusted basis. Additionally, option-selling strategies can be used to generate higher income for an investor’s portfolio during periods of heightened volatility. We believe PUTW and RPUT are very strong candidates for any risk-sensitive equity asset allocation.
Disclaimer: Investors should carefully consider the investment objectives, risks, charges and expenses of the Funds before investing. U.S. investors only: To obtain a prospectus containing this ...
more


