
Nasdaq Elliott Wave Analysis: Ending Impulsive Move
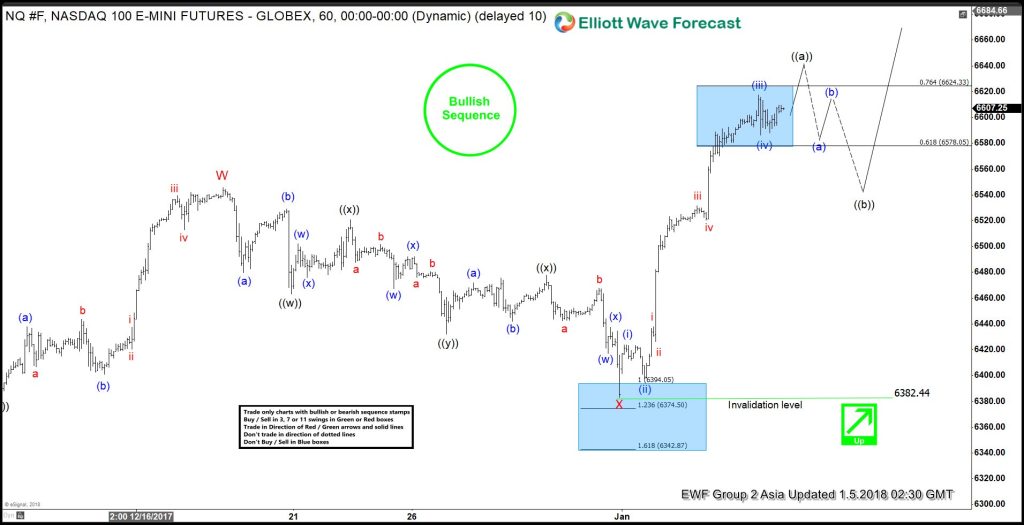
Short Term Nasdaq Elliott Wave view suggests that the rally from 12/5 low unfolded as a double three Elliott Wave structure where Minor wave W ended at 6545.75 and Minor wave X ended at 6383.25. This week, the Index made a new high above Minor wave W at 6545.75, suggesting the next leg higher has started. Internal of Minor wave W unfolded as a double three Elliott Wave structure where Minute wave ((w)) ended at 6427.75, Minute wave ((x)) ended at 6383, and Minute wave ((y)) of W ended at 6545.75.
Internal of Minor wave X pullback unfolded as a triple three Elliott Wave structure where Minute wave ((w)) ended at 6463.25, Minute wave ((x)) ended at 6520.75, Minute wave ((y)) ended at 6432.25, and second Minute wave ((x)) of X ended at 6382.44. Near term, rally from 12/30 low (6383.25) is unfolding as an impulse Elliott Wave structure and could see more upside to end 5 waves up in Minute wave ((a)). Afterwards, the Index should pullback in Minute wave ((b)) in 3, 7, or 11 swing to correct cycle from 12/30 low (6382.44) before the rally resumes. We don’t like selling the Index and while Minute wave ((b)) dips stay above 6382.44, expect Index to extend higher.
Nasdaq 1 Hour Elliott Wave Chart
Disclaimer: Futures, options, and over the counter foreign exchange products may involve substantial risk and may not be suitable for all investors. Leverage can work against you as well as for you. ...
more

