
Modeling Chaos & Stability In The Stock Market
Probing the link between financial markets and chaotic states, fractals, and related topics dates to the 1960s, when mathematician Benoit Mandelbrot effectively launched this line of research with his seminal study of cotton prices that documented “recurring patterns at every scale in data,” notes Wikipedia. The subject of chaos and how to exploit it for profit is an ongoing arena for study, albeit with mixed results. The Hurst exponent, for instance, attracted a lot of interest a number of years ago, in part due to an influential and widely read review of the indicator by Edgar Peters in his 1991 book Chaos and Order in the Capital Markets: A New View of Cycles, Prices, and Market Volatility.
There’s still plenty debate about how one might apply the Hurst exponent and related metrics in the day-to-day business of money management. Yet the field of chaos theory remains an intriguing and potentially rewarding area for research. My own interest in this corner has waxed and waned over the years, but I was intrigued anew when I read David Varadi’s brief but thought-provoking essay in March on “Using a Self-Similarity Metric with Intraday Data to Define Market Regimes.” As he explains,
Self-dissimilar objects are associated with complexity and chaos. Several mathematicians (including Mandelbrot) have observed that markets are clearly non-gaussian or non-normal. Markets exhibit “fat-tails” and have a distribution that shares more in common with a Levy distribution than the normal distribution which is used frequently in quantitative finance. But the market does not have a constant distribution- at times the market behavior is fairly normal in character while at other times the market is wild and unpredictable. The question is how we can effectively determine which regime the market is in so that we can apply the appropriate trading strategies to mitigate risk.
Varadi offers a simple but potentially useful answer with a measure of self-similarity based on analyzing the market’s intraday range and how it changes in the short term relative to a longer-run window. As a basis for further exploration, let’s take a stab at translating Varadi’s instructions by generating the data in R (see code below) for analyzing the US stock market via the S&P 500.
Varadi advises that “values above 0.5 indicate that the market is in a ‘chaos’ regime and is much less predictable and non-stationary; values below 0.5 indicate that the market is stable and much more predictable.”
Here’s a look at the indicator over the past year:
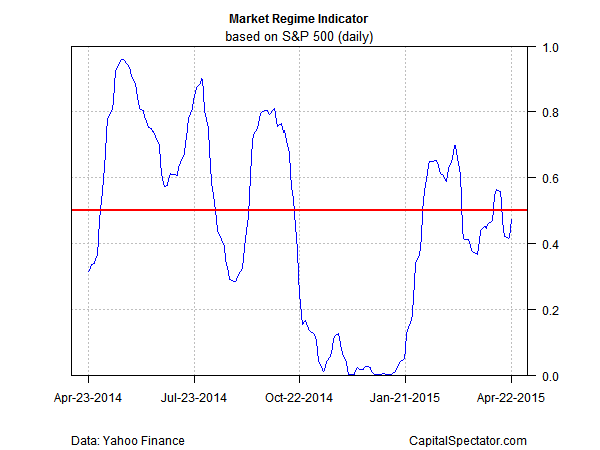
Note that this metric has been bouncing around the 0.5 mark recently (red line in chart above), which suggests an equilibrium/neutral condition. That’s in contrast with the stable regime (below 0.5) that prevailed in late-2014 through this past January.
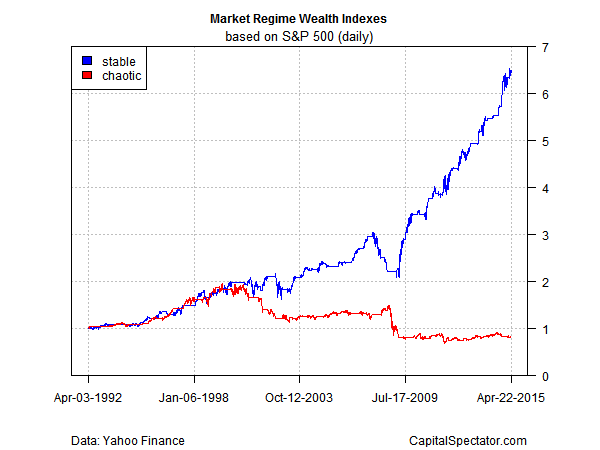
Why is any of this relevant? Because most of the gains in the stock market through time are generated during the stable regime. As an illustration, let’s reproduce a chart in Varadi’s post, where he separates the stable regime from its chaotic counterpart and generates wealth indexes for each data set. The key message, he notes, is that “the market performs quite poorly in ‘chaos’ conditions, and seems to make all of its long-term returns in the ‘stable’ regime.”
The notion that trending/momentum factors are valuable sources of risk premia is old news, of course. The challenge is figuring out when market conditions are ripe for earning a profit from these factors… and when they’re not.
Varadi’s indicator is hardly the last word on modeling the market’s evolution between chaos and stability, but it’s a useful first approximation. As such, it’s a good benchmark for additional research and looking for possibilities for enhancing this signal. (For additional perspective on this indicator, take a look at his follow-up piece here.)
Disclosure: None


