
Markets On The Edge
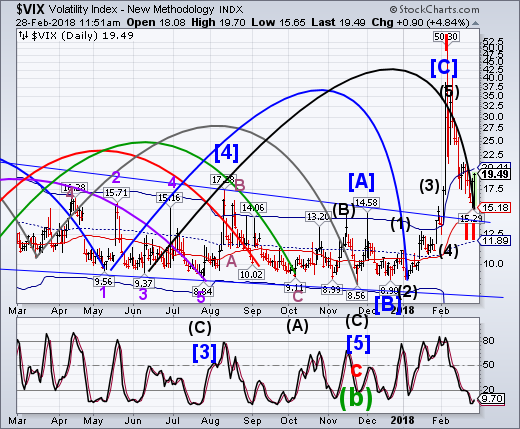
VIX made an 83% retracement of its rally on Tuesday while making its Master Cycle low. Today it challenged Cycle Top support at 20.41, but closed beneath it. A close above it implies a VIX buy signal may have occurred. The Cycles Model now indicates that the rally may continue for up to three weeks. That implies the next wave higher may have started today.
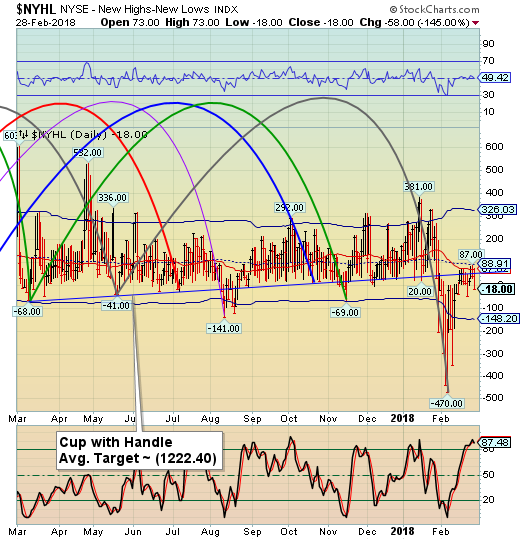
-- The NYSE Hi-Lo Index has tested mid-Cycle resistance today but has closed beneath it, reactivating a NYSE sell signal. The Cycles Model suggests that much lower lows may be imminent. The pundits still have no clue.
(ZeroHedge) Confused by today's whipsawed market action, which as much about month-end flows, as it is about newsflow, post-Powell jitters, breakevens, inflationary fears, and of course, whatever it is that Gartman may be doing? You are not alone: in its intraday macro update, the bank that is also the world's largest currency trader, had some (very) simple advice for its clients: "Don't try to make sense of this."
It then clarifies, and we use the term loosely: "Price action today has been messy to say the least. The shortest explanation is, it's month end and so there is little point in making sense of the move."
.png)
-- SPX made a made a key reversal yesterday by rallying to the upper trendline of the Broadening Wedge formation, then closing beneath the prior day’s low. Today it closed beneath the 50-day Moving Average. This puts the SPX back on a confirmed sell signal. Fractal analysis and the Broadening Wedge formation both suggest proposed targets beneath Cycle Bottom support at 2328.63. However, crossing the blue trendline at 2675.00 implies a larger decline to 1800.00.
(Bloomberg) It’s testament to how rough stocks had it in February that the last two days, a stretch that would’ve qualified as the worst selloff in all of 2017, barely shows up in a monthly graph.
Not that it wasn’t painful. The S&P 500 Index slid 2.4 percent over Tuesday and Wednesday to cap the biggest monthly retreat since January 2016, as concerns about Federal Reserve policy brought out sellers and briefly pushed the Cboe Volatility Index back above 20. Breadth, a concern even as stocks rallied nine of 11 days starting Feb. 9, evaporated Wednesday, with only 15 percent of the S&P 500 managing gains.
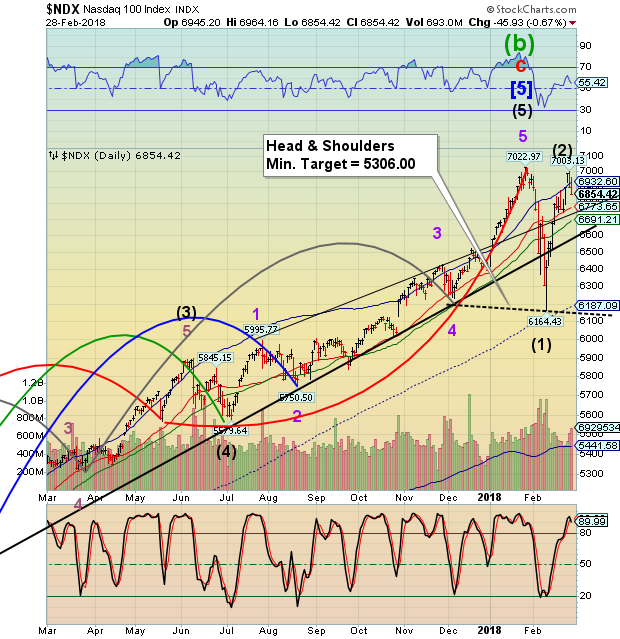
-- NDX rallied within 20 points of its all-time high before reversing back down on Wednesday. A close beneath Intermediate-term support at 6773.65 and the Ending Diagonal trendline at 6750.00 may reinstate the sell signal.
(ZeroHedge) Bulls are back to dining at the “V”, the magic quick dip correction that never happened. The price action appears massively bullish, yet the data underneath is not at all. Instead it appears more associated with bull market end-times.
The final thrashing about which we’ve seen several times before. After all the tops of 2000 and 2007 were marked by a sudden acceleration in volatility and sudden corrective moves exceeding 10% followed by rallies of the similar magnitude. The underlying theme of these subsequent rallies: Narrowing of leadership, negative divergences and a renewed bullishness breathing a sigh of relief at precisely the wrong time.
This is exactly what we are witnessing now and let me highlight the Nasdaq in particular as there are cracks appearing amidst this aggressive rally back to highs.
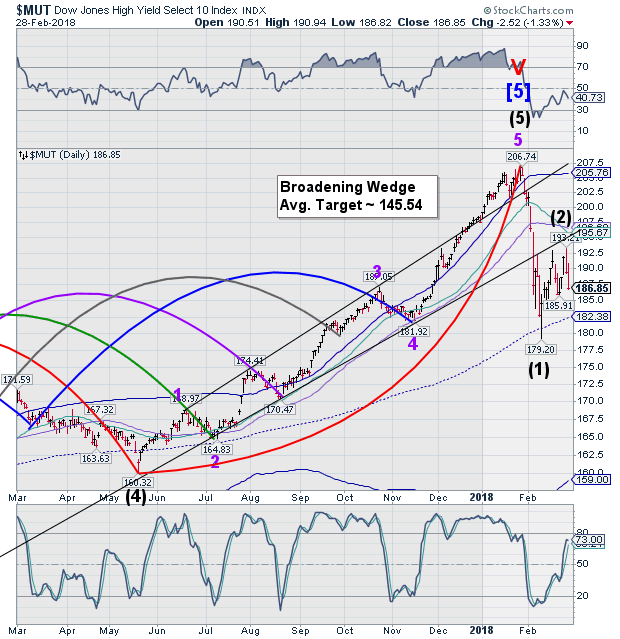
-- The High Yield Bond Index attempted another run at the Broadening Wedge trendline, only to stop short, making nearly a 51% retracement. \A decline beneath mid-Cycle support at 182.38 may result in a panic, since it has retested its 2-year trendline a third time and failed.
(Bloomberg) The recovery in high-yield bonds is on thin ice, according to a growing pack of investors willing to make a hefty wager on their conviction.
Demand to short the three largest exchange-traded funds tracking the asset class surged to more than $7 billion this week, according to data from Ihs Markit Ltd. published Wednesday. That’s the highest on record.
Short interest as a percentage of shares outstanding on the $15 billion iShares iBoxx $ High Yield Corporate Bond ETF, ticker HYG, hit an all-time high of 29 percent Monday, Markit data show. Add elevated shorts on the SPDR Bloomberg Barclays High Yield Bond ETF, ticker JNK, in concert with a European counterpart, and bearish sentiment has piled up even as junk-bond spreads recover from the selloff earlier this month.
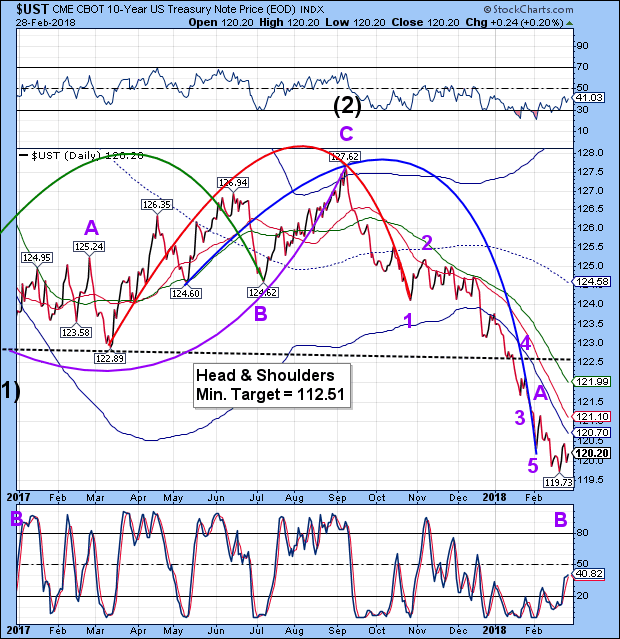
UST bounced on February 21 and appears to be headed higher. The bounce may last up to two weeks, but only to test overhead resistance. The Cycles Model suggests the waterfall decline may resume through late March once the bounce is complete.
- Bloomberg) It’s perhaps the biggest question for financial markets in 2018: How high will Treasury yields climb? The next month may just hold the answer.
After the benchmark 10-year U.S. note yield hit 2.9537 percent on Feb. 21, a four-year high, it seemed inevitable that 3 percent was in the cards. Yet buyers emerged, some Wall Street strategists trumpeted their bullish views once more and suddenly the “bond bear market” didn’t have quite so much momentum.
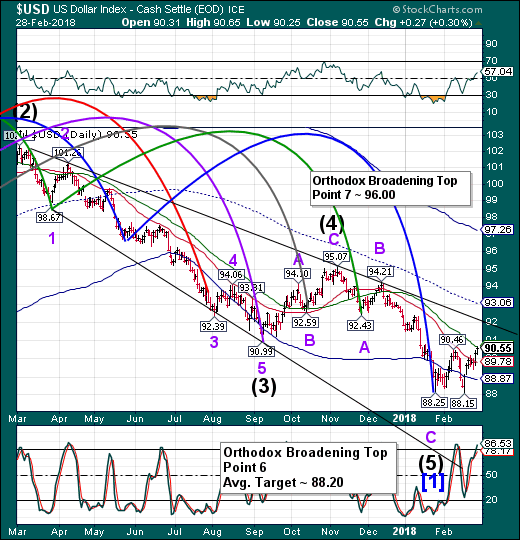
- The U.S. Dollar rallied to the 50-day Moving Average today. There may be a brief pullback, but there is still a probable move to the opposite side of the trading channel to point 7 of the Orthodox Broadening Top formation shown in the weekly chart. The next probable resistance point may be the trendline directly overhead.
(DailyFX) The US Dollar has continued to trade higher on Wednesday, following gains yesterday stemming from new Fed Chair Jerome Powell’s testimony in front of the House Financial Services Committee. While he is not due to reappear today, traders are still digesting the commentary which suggested that a faster pace of rate hikes could be coming in 2018. With the DXY Index back at its highest levels in three weeks, EUR/USD dropped to its lowest level since February 9. Another weak inflation print out of the Eurozone has contributed to the Euro’s weakness, when put in context of comments made by ECB President Mario Draghi (among other policymakers) about the need for continued extraordinary stimulus earlier this week.
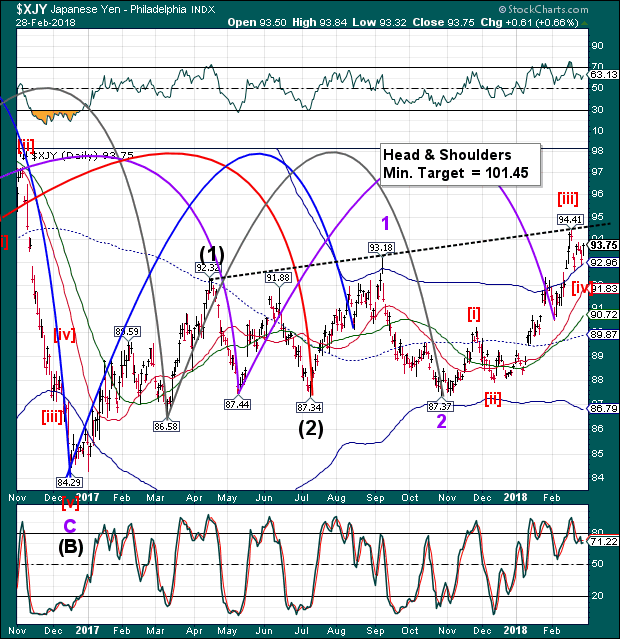
--The Yen continues to test the Cycle Top support at92.96 as it consolidates its gains. The Cycles Model suggests the consolidation may be complete and strength returning over the next two weeks. Should the Yen exceed the proposed Head & Shoulders neckline at 94.41, the Yen may extend beyond 100.00.
(CNBC) The Japanese yen's rapid appreciation since the start of 2018 has made it one of the best-performing currencies so far — and there's room for further strengthening.
The yen is expected to stay strong partly due to weakness in the U.S. dollar, which has made the greenback less attractive as a "safe haven" asset. As a result, the U.S. dollar-Japanese yen pair has traded down by 4.73 percent between Jan. 1 and Feb. 27.
A number of research houses, including Morgan Stanley and ING, have predict that the pair will continue trending downward.
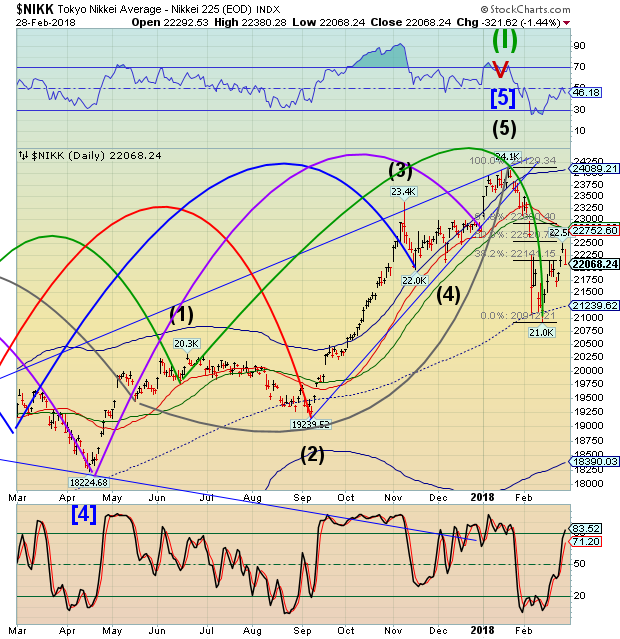
The Nikkei vaulted to the 50% retracement level before reversing on Tuesday. The Cycles Model suggests weakness through mid-March. If so, there may be a retest of the lows. It also suggests Nikkei Index may be set up for a crash starting this week.
(EconomicTimes) Japan's Nikkei share average fell on Wednesday, snapping a three-day winning streak, pressured by losses on Wall Street and a larger-than-expected fall in Japanese industrial output.
The Bank of Japan's decision to trim purchases of super long bonds also soured sentiment by boosting the yen.
The Nikkei ended 1.4 percent lower at 22,068.24 points.
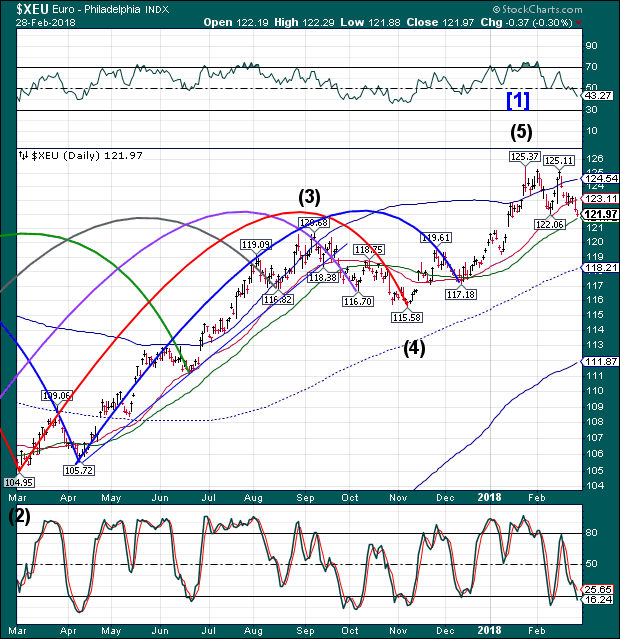
-- The Euro declined under Intermediate-term support at 123.11 leaving a potential sell signal. Crossing beneath the 50-day Moving Average confirms the signal. It may be ripe for a flash crash as The Cycles Model suggests a potential decline to the Cycle Bottom in the next week.
(Bloomberg) New Federal Reserve Chair Jerome Powell has already made an impression. He has, shockingly, told us what he thinks: “My personal outlook for the economy has strengthened since December.” The dollar rose and sapped some of the life out of the euro.
Powell's candor could also take the heat out of the currency spat between the European Central Bank and the U.S. administration. The latest ECB minutes showed serious concern on the Governing Council over officials' remarks on the benefits of a weaker dollar.
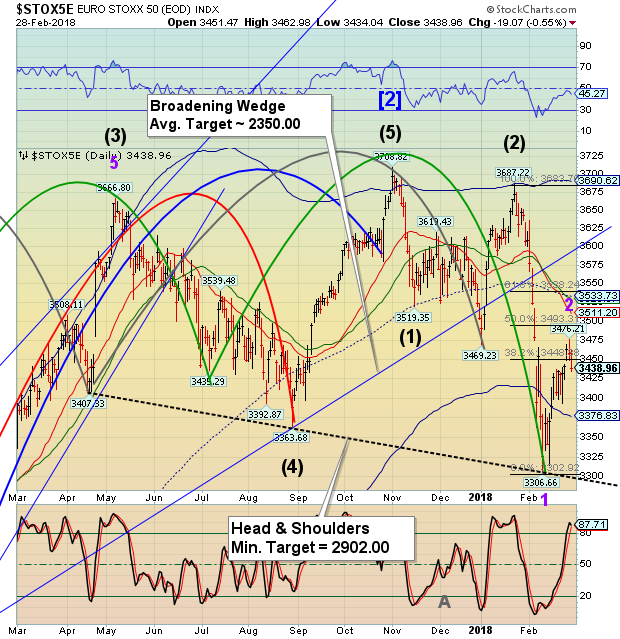
EuroStoxx 50 Index rallied but fell short of a 50% retracement of its most recent decline. The period of strength appears to have been extinguished and weakness may resume through mid-March. European stocks may be starting a panic phase in its decline this week.
(CNBC) Equity markets in the U.S. are on the road to recovering post-correction losses, but European stocks may be set to stall out, according to a recent Oppenheimer report.
The Euro Stoxx 50 index — composed primarily of blue-chip names in major Eurozone markets such as Germany, France, and Italy — has shown significant weakness lately and will likely continue underperforming the S&P 500, according to Ari Wald, Oppenheimer's head of technical analysis.
At this juncture, the index could prove to be a sort of canary in a coal mine, he told CNBC's "Trading Nation."
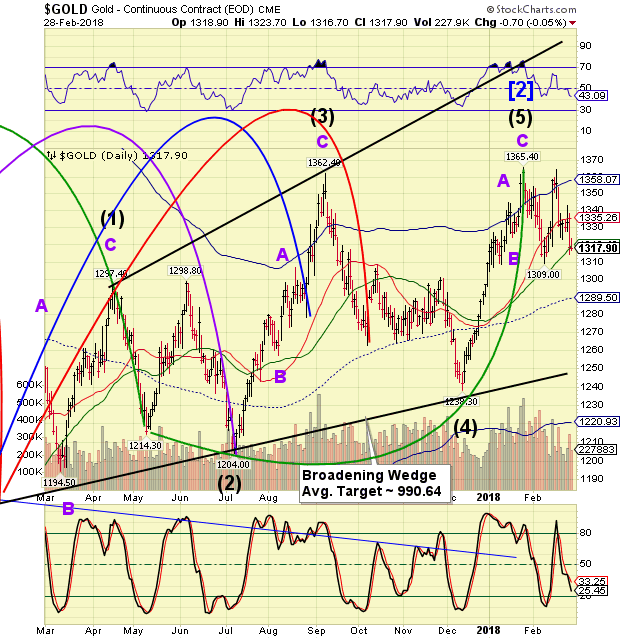
-- Gold attempted a consolidation at the 50-day Moving Average, but closed beneath it, confirming the sell signal. Any bounce here may be short-lived, as it has a Master Cycle low due in about three weeks.
(Reuters) - Gold prices steadied on Wednesday after the previous session's more than 1 percent fall following comments by the Federal Reserve's new chairman that fueled views the U.S. central bank would raise rates four times this year rather than three.
The dollar hit a five-week high versus a basket of currencies, lifted by Fed Chairman Jerome Powell's upbeat assessment of the U.S. economy on Tuesday.
A strong dollar makes dollar-priced gold costlier for investors using other currencies.
Spot gold was flat at $1,317.94 per ounce by 1:34 p.m. EST (1834 GMT) and was poised to close February down 2 percent. On Tuesday, it hit the lowest since Feb. 9 at $1,313.26.
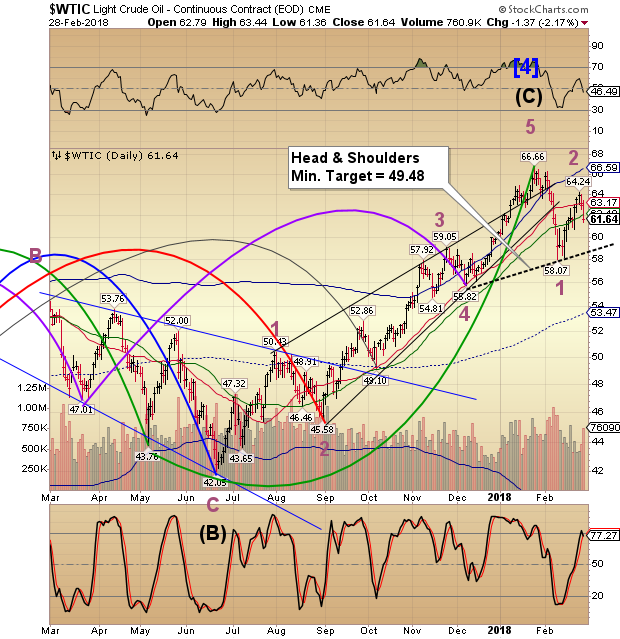
West Texas Intermediate ended its retracement on Monday after making a 72% retracement. It closed today beneath the 50-day Moving Average at 62.10, putting crude on a confirmed sell signal. The Cycles Model suggests the decline may resume through the end of March.
(OilPrice) A day after the American Petroleum Institute gave oil bulls a cold shower by reporting a 933,000-barrel build in crude oil inventories on top of a gasoline build, the Energy Information Administration deepened the gloom by reporting a 3-million-barrel build for the week to February 23.
Analysts had expected the EIA to report a 1.2-million-barrel build in crude oil inventories, so the actual figure is likely to be felt as a slap in the face for many.
Gasoline stockpiles were also up, by 2.5 million barrels. That compares with a 300,000-barrel build in the previous week. Production averaged 9.4 million bpd in the week to February 23, down from 10.1 million bpd a week earlier. Refineries operated at 87.8 percent of capacity, processing 15.9 million bpd of crude.
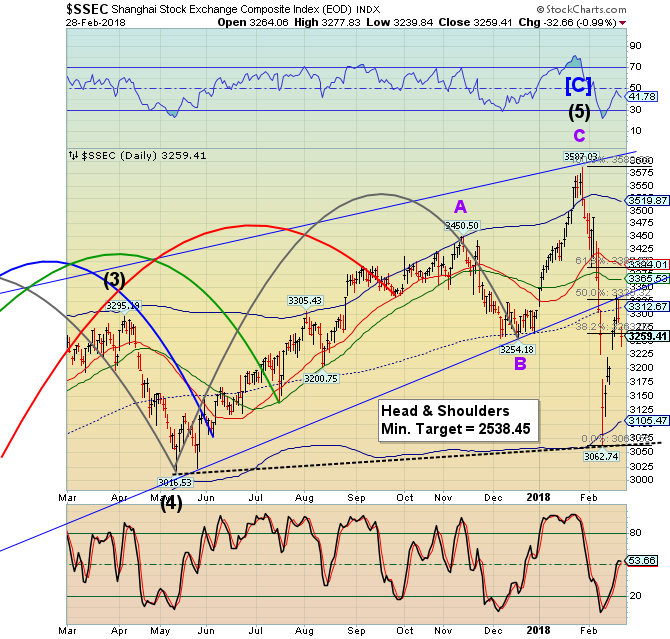
The Shanghai Index completed a 50% retracement while testing its Ending Diagonal trendline on Monday. The test appears complete and a new decline underway. The Shanghai is also due for a panic decline. The Cycles Model suggests a break of the neckline and Master Cycle low in the next two weeks.
(ZeroHedge) Even allowing for the lunar new year's distortions, Chinese PMI data is a disaster, piling on to the disaster that saw 1st Tier home prices sink most since 2015, and Anbang Insurance bailed out by regulators (due to liquidity concerns).
While some suggested pollution curbs (or regulatory efforts to control debt and leverage) could be blamed for the declines, consensus economists were likely fully aware of the calendar and the government policies and still drastically misplaced their optimism.
The Manufacturing PMI fell to 50.3, compared with a 51.1 forecast in Bloomberg’s economist survey and 51.3 the prior month.
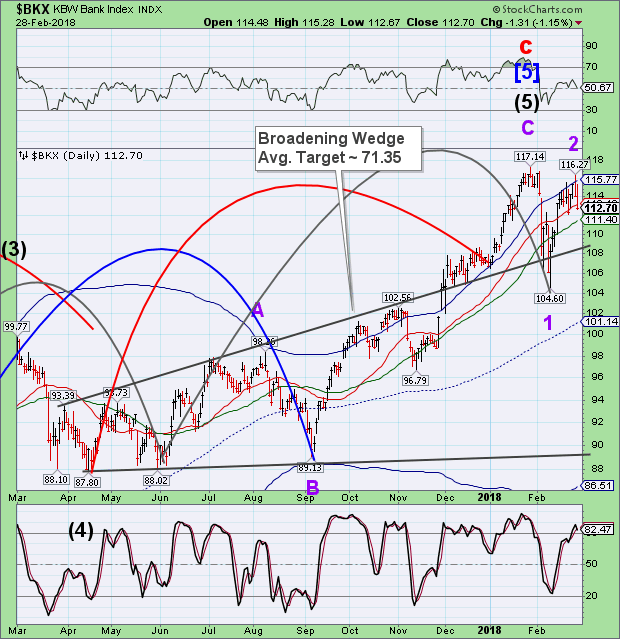
-- The BKX challenged its Cycle Top resistance at 115.77 on Tuesday but failed to hold it as support. Gravity took over the index today, closing the index beneath Intermediate-term support/resistance. This puts the Banking Index on a sell signal that may be confirmed beneath the 50-day Moving Average at 111.40.
(Bloomberg) JPMorgan Chase & Co. just weighed in again on virtual currencies -- very discreetly.
It’s not a prediction. And it doesn’t speak to Chief Executive Officer Jamie Dimon’s own declarations on Bitcoin -- which he once called a “fraud,” and then later reconsidered, saying the underlying technology is “real.”
This time, the comment is tucked into the bank’s 301-page annual regulatory filing in a wide-ranging list of hypothetical risks to its business. The gist: Cryptocurrencies are among innovations that could someday disrupt parts of the financial system. Speaking generally, JPMorgan added, a variety of new technologies could force the company “to spend more to modify or adapt its products to attract and retain clients and customers.”
(Quartz) India’s state-run lenders and its banking regulators, along with the government and taxpayers, must be glad that February has ended.
The month saw a string of frauds and scams being exposed across the country, translating to a loss of nearly $2.5 billion to the system. This included those perpetrated by jewelers Nirav Modi and Mehul Choksi, Rotomac’s Vikram Kothari, and Simbhaoli Sugars. What may have added to the sector’s woes is the government’s reaction, which may have sprung from the desperation to be seen acting decisively.
(ZeroHedge) The end of the era of cheap money highlights the risk of “Enron-style” bankruptcies in many sectors, including renewable energy. With the path of three rate hikes in the United States in 2018 confirmed by the Federal Reserve and a nervous equity market, the challenges are more evident than ever.
The past eight years of massive liquidity and low rates have not helped deleverage, and many companies have used this period to increase imbalances and create complex debt structures. In fact:
- Corporate net debt to EBITDA levels is at record highs. About 20% of US corporates face default if rates rise, according to the IMF.
- The number of zombie companies has risen above pre-crisis levels according to the Bank of International Settlements (BIS).
This is particularly evident in the renewable sector where, even in the years of high liquidity and low rates, bankruptcies soared.
Disclaimer:
Nothing in this email or article should be construed as a personal recommendation to buy, hold or sell short any security. The Practical Investor, LLC (TPI) may provide a ...
more

