
Market’s Bias Within Range Favors Bulls
An Even Battle Between Bulls And Bears?
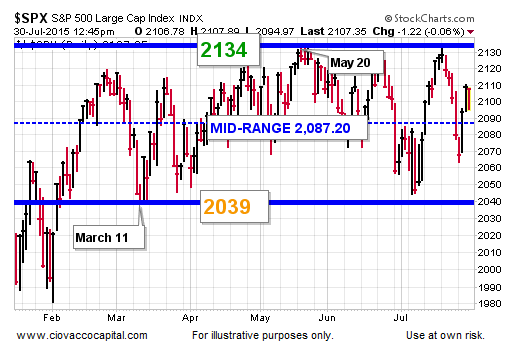
The S&P 500 made an intraday low of 2039 on March 11, 2015. The intraday high in the current range was made on May 20. Since then, the S&P 500 has traded between 2039 and 2134. The mid-point of the range is 2087.
There Has Been A Clear Bias Within The Range
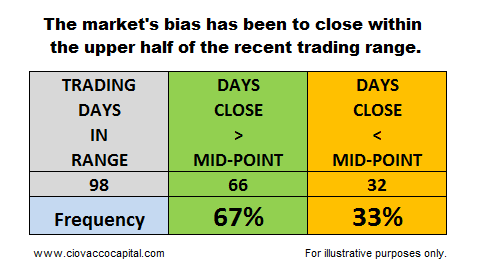
Has the recent trading range been an even battle between the conviction to own stocks and the conviction to sell stocks? If so we would expect to see about a 50%/50% split between days spent in the top half of the range and days spent in the bottom half of the range. As shown below the bias has been to close in the upper half of the range. The S&P 500 has been within the range for 98 trading days. It closed in the upper half of the range on 66 of those 98 days.
Weekly Picture
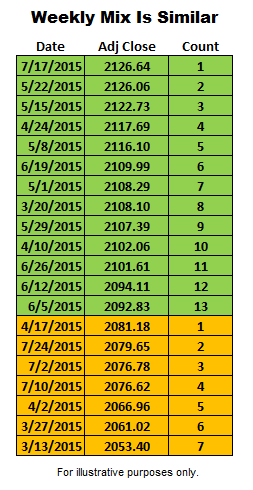
Since a daily closing price represents the final outcome between bulls and bears in a trading session, it provides better information than an intraday price. The same can be said for a weekly closing price relative to an intraweek price. The weekly score also says “the conviction to own stocks has been greater than the conviction to sell stocks, even within the context of the recent trading range”.
Investment Implications
Is this analysis a reason to mortgage the house and buy stocks? No, not even close. However, it does represent another piece of data, similar to recent extreme sentiment readings, telling us to keep an open mind about all outcomes, including better than expected outcomes.
Disclosure: This post contains the current opinions of the author but not necessarily those of Ciovacco Capital Management. The opinions are subject to change ...
more

