
THE CROSSING
As opposed to the week prior, the market action during the first half of this past week was much more positive. What was interesting, was despite the absolute drubbing that investors have taken since the beginning of the year, the three-day advance saw a surge of “bulls” running into the fray “claiming victory” over the bears. This is hardly the case.
In last week’s missives, I discussed the potential for an oversold, short-covering bounce which was to be used to further rebalance portfolios and reduce equity risk. The target zone was 1940 to allow for the completion of the “risk reduction” process.
“On a very short-term basis the market is oversold and the bounce on Friday was JUST enough to close above the October lows support at 1860. Any continued rally next week should be used to further reduce equity risk and rebalance portfolios.”
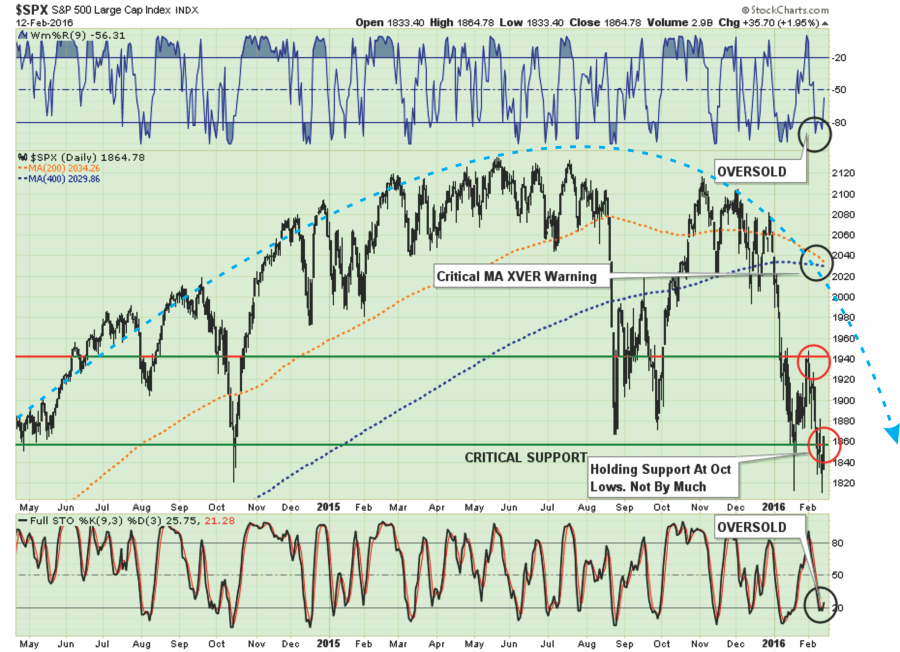
“However, market bulls will argue, and correctly so, that the continued retests of the 1860 level by the markets is building bullish support for the market. However, this action is not uncommon at major market peaks as it takes time to erode bullish “hopes” to the point those supports finally give way.
With the markets once again oversold after last week’s fairly brutal sell-off, a rally is expected over the next couple of days to allow portfolio risk to be rebalanced. That rally could take the markets back to the previous resistance of 1940 (about a 4% push) from current levels. Such a rally would be enough to suck many of the“bulls” back into the markets pushing markets back into overbought territory and setting up the next decline.”
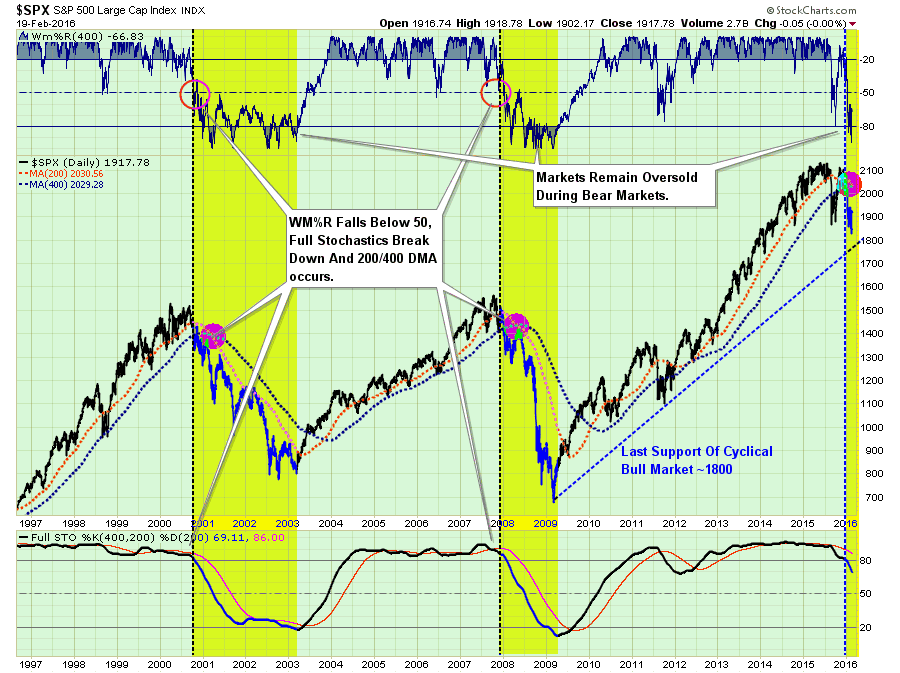
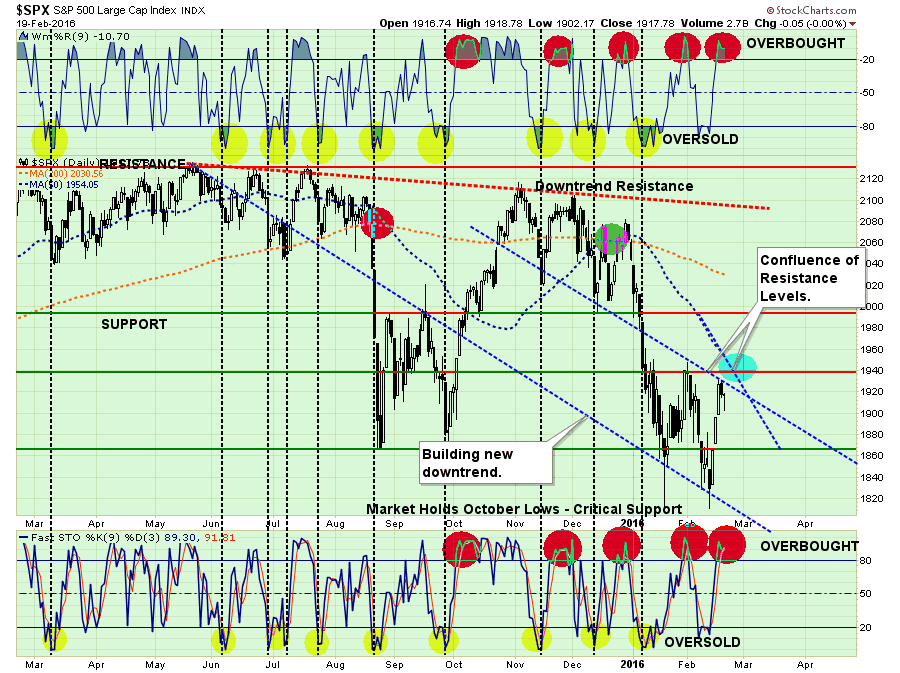
I have updated the chart above, below. As discussed last week, the “bulls” did come stampeding back into the market as expected which pushed the markets back into extreme overbought territory.
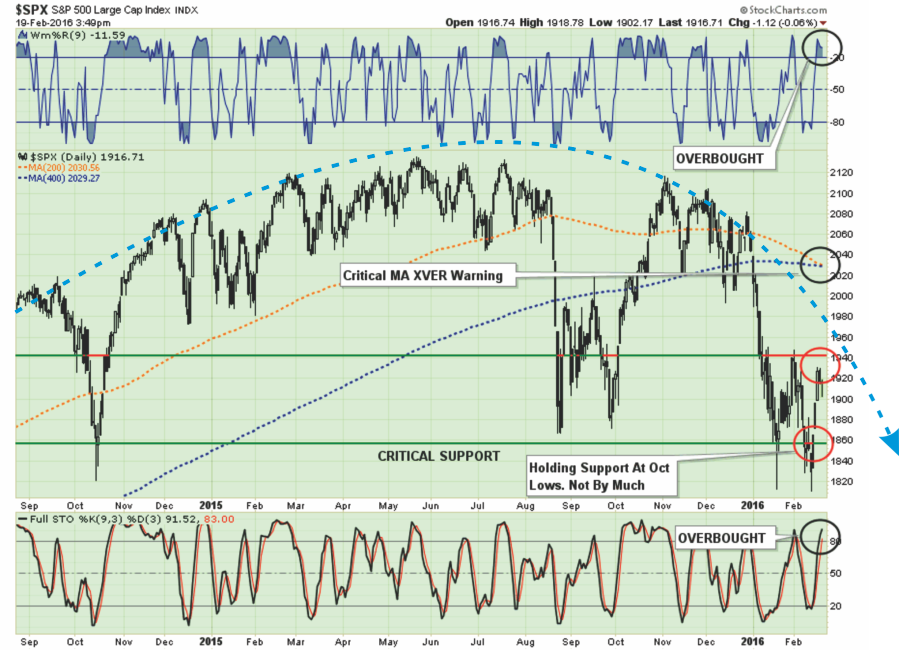
Importantly, note that in the last week the spread between the 200 and 400-dma collapsed this past week from a near 5-point spread to just a little more than 1-point at Friday’s close. This signal will cross next week. Whether or not the “crossing” is the signal of a new cyclical bear market is yet to be seen, but historically it has almost always been the case.
TOO MANY BEARS?
While there are many indicators suggesting more extreme levels of bearishness, which are often the catalysts for at least a short-term push higher in the markets, this has not always been the case. As shown in the chart below, courtesy of Ed Yardeni Research, the bull/bear ratio is now under 1.0 which suggest rather extreme levels of bearishness. Time for the bear market to be over, right? Not so fast.
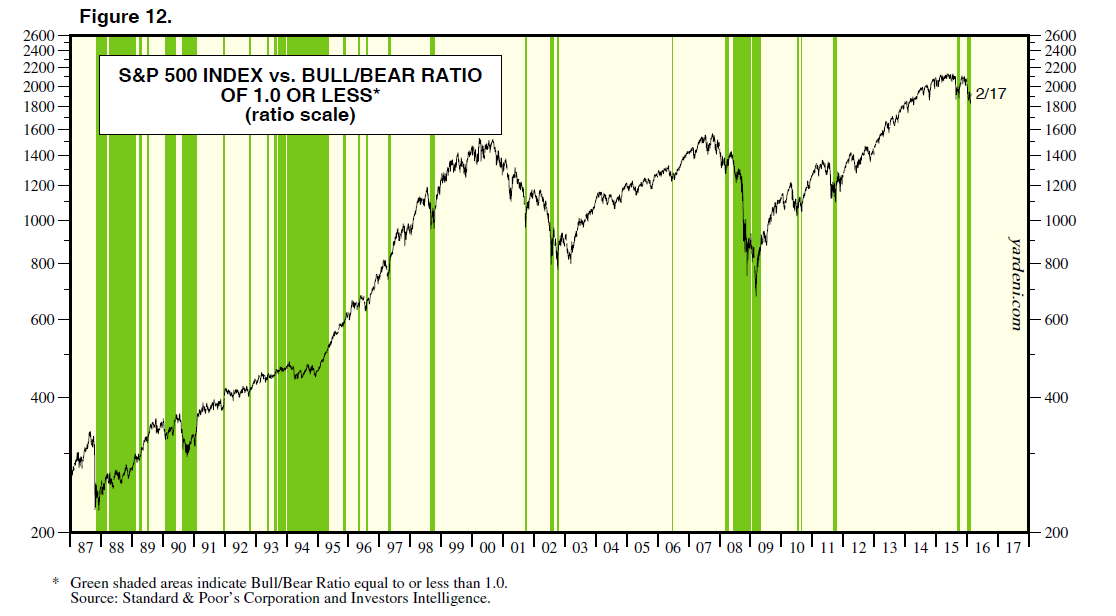
As you will notice, while in many cases excess bearishness led to rallies during cyclically trending bull markets, during more “bearish” markets, bearishness tended to remain bearish and rallies led to deeper corrections.
However, while bearish sentiment generally provides fuel for shorter term rallies, it is ultimately the underlying fundamentals that provide the sustainability to market direction. As Yardeni also point out, markets tend to follow fundamental underpinnings very closely. If the current downturn in fundamentals continues to build momentum, the markets could be very early in their corrective process.
As I have noted before, bearishness tends to remain a constant companion during cyclical bear markets. As investors are repeatedly molested by ripping bull rallies, and plunging declines, such action keeps markets in oversold territory until the “beatings have improved overall morale.”
Yes, this time “could be different.”
The Fed could use negative rates, launch another round of QE, or even a combination of the two which would once again push markets higher. However, until such a “Unicorn” appears, we must live in the land of reality and deal with“what is.”
OECD – IT ISN’T MENTAL THING
Beginning in 2011, I began tracking the Federal Reserve’s quarterly economic assessments released after each of the policy-making meetings. Besides the fact they are the absolute worst economic forecasters ever, it was provided to give a sense of transparency into the Fed’s actions.
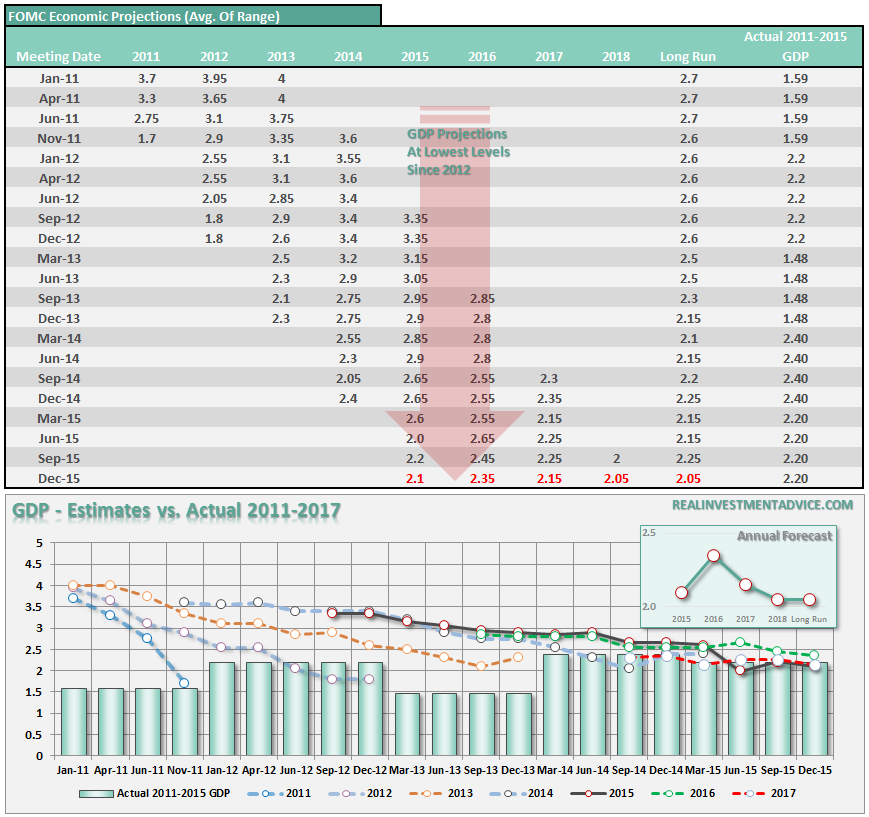
However, following the January policy meeting, there was a very material issue, “no economic outlook.”From the NYT:
“The Fed in recent years has issued an assessment of its economic outlook after each meeting of its policy-making committee, but that assessment was missing from the statement after the most recent meeting in January. An official account, published on Wednesday after a standard three-week delay, makes clear that Fed officials simply did not know what to say.”
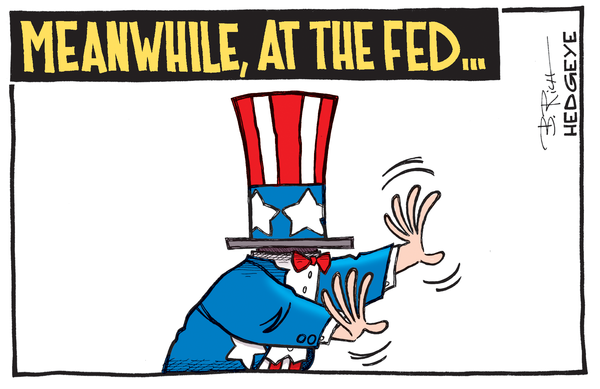
HedgeEye nailed it with this cartoon:
Apparently, if we want an assessment of the domestic and global economy, we need to visit Switzerland and speak with William White, Chairman of the OECD and former Chief Economist for the Bank of International Settlements, to wit:
“The situation is worse than it was in 2007. Our macroeconomic ammunition to fight downturns is essentially all used up.
Debts have continued to build up over the last eight years and they have reached such levels in every part of the world that they have become a potent cause for mischief.
It will become obvious in the next recession that many of these debts will never be serviced or repaid, and this will be uncomfortable for a lot of people who think they own assets that are worth something.
The only question is whether we are able to look reality in the eye and face what is coming in an orderly fashion, or whether it will be disorderly.”
And Mr White said the Fed is now in a horrible quandary as it tries to extract itself from QE and right the ship again.
“It is a debt trap. Things are so bad that there is no right answer. If they raise rates it’ll be nasty. If they don’t raise rates, it just makes matters worse.
It was always dangerous to rely on central banks to sort out a solvency problem when all they can do is tackle liquidity problems. It is a recipe for disorder, and now we are hitting the limit.”
And then there is this:
“If policymakers appear defenseless in the face of a fresh threat to the world economy, it is in part because they have so little to show for their past efforts. The balance-sheets of the rich world’s main central banks have been pumped up to between 20% and 25% of GDP by the successive bouts of QE with which they have injected money into their economies (see chart 1). The Bank of Japan’s assets are a whopping 77% of GDP. Yet inflation has been persistently below the 2% goal that central banks aim for.
In America, Britain and Japan, unemployment has fallen close to pre-crisis levels. But the productivity of those in work has grown at a dismal rate, meaning overall GDP growth has been sluggish. That limits the scope for increases in real wages and in the tax receipts needed to service government debt.”
As I have repeatedly discussed in this missive, despite the constant gum-flapping of “nattering nabobs” the economy is no-where near recession, this is only due to the skewing of the data by seasonal adjustments in the short-term. Over the next year as current economic data is negatively revised, the true weakness in the economy will be exposed.
But if you don’t believe me, how about a raging bull now turned economic “bear.” Joe LaVorgna, in a recent interview, stunned CNBC hosts with a smattering of the truth about what is currently happening beneath the bullish headlines.
Or, how about the same from real estate investing legend Sam Zell, who built the multi-billion dollar empire of Equity Office Properties and sold just prior to the financial crisis.
Okay, see, its not just me. While I have been quite clear that the economic data simply does not support the bullish meme, the trend of prices, deterioration in internal measures and decline in momentum, all suggest that the market has figured out the “game is afoot.”
THE MONDAY MORNING CALL
“Stocks finish the best week of the year!”
That was the headline from Myles Udland at Business Insider on Friday. Talk about pandering to the bullish hype, really?
Given that we are now almost two full months in the year the markets strung together its FIRST three-day win streak which totaled a whopping 2.5% gain. That is a pretty dismal showing on just about every front considering we are in the “seasonally strong” period of the year.
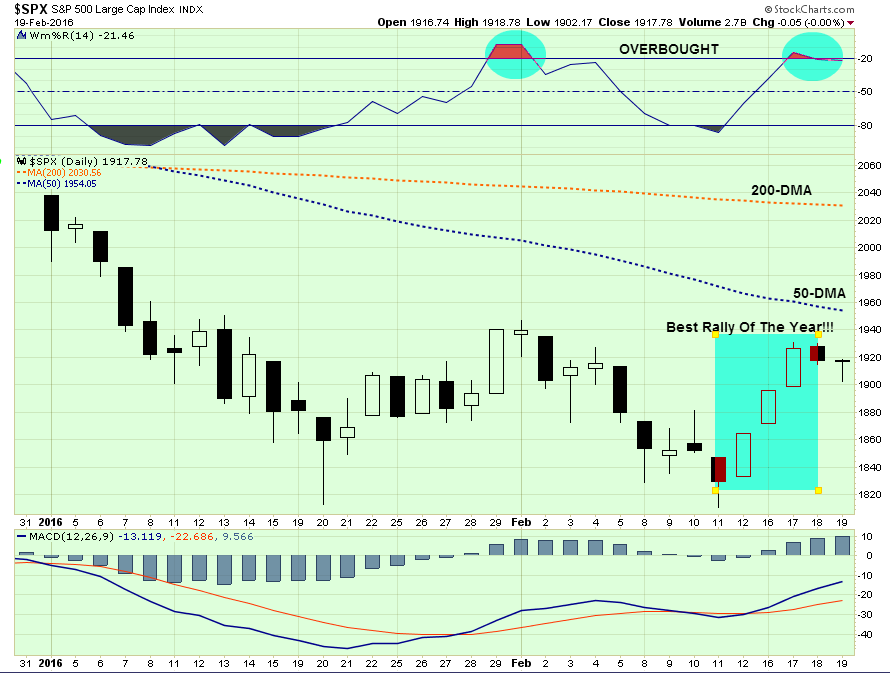
Setting aside the “bullish arm-waving” by journalist portraying themselves as astute practitioners of money management for the moment, a look at the next chart shows something much ominous.
Markets do not rise and fall in a straight line. The vacillate from overbought to oversold and back again. Sharp reflexive bounces are predominately found during corrective markets as selling pushes prices to extreme oversold conditions which leads to short-covering rallies. Like striking a match, short-covering rallies burn fast and furious, but are quickly exhausted and then fade.
The recent market rally, in typical short-covering fashion, ran from the bottom of the current downtrend to the top. At the same time, the market moved from extremely oversold to overbought once again. With the 50-dma and resistance from the previous high sitting directly overhead, the markets will face a fairly tough challenge next week. A failure to push through that resistance will lead back to a retest of recent lows.
Another fairly substantial concern at this juncture that keeps portfolios positioned more cautiously is recent volume.
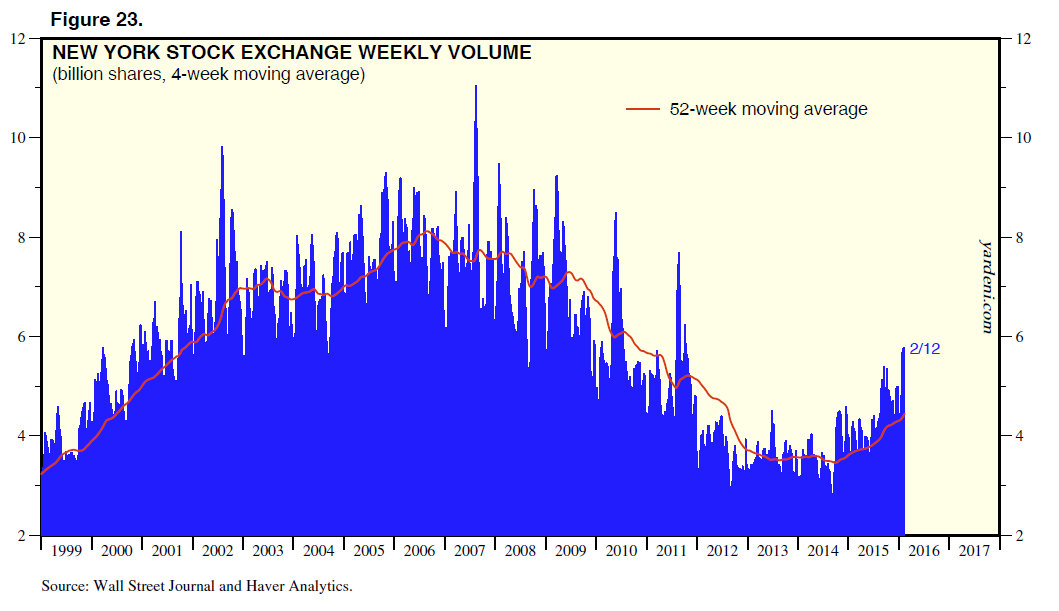
During the markets bullish advance from 2009 through 2013, volume on the market declined. As the Fed began to wind down the final round of QE, and began to tighten interest rates, market volatility picked up significantly.Following the turmoil that began last August, volume has picked up markedly confirming that we have likely entered into a more protracted cyclical bear market.
NOW WE WAIT
Last week I recommended using any rally this week to move to the lowest level of equity exposure for this part of the cycle. (When the bear market is confirmed we will take portfolios to market neutral by hedging off any remaining equity risk, but we are not there as of yet.)
I suggested doing this by:
- Trimming back winning positions to original portfolio weights: Investment Rule: Let Winners Run
- Selling positions that simply are not working (if the position was not working in a rising market, it likely won’t in a declining market.) Investment Rule: Cut Losers Short
- Holding the cash raised from these activities until the next buying opportunity occurs. Investment Rule: Buy Low
As such there is now little for us to do except to wait, and watch patiently, for the market to either confirm a “bear market,” OR stabilize and begin to rebuild the bullish supports necessary to allow equity risk to once again be increased.
Neither situation will make itself apparent in short order, so relax and we let the market dictate what actions we take next. “Guessing” at the markets has not typically been a successful and repeatable strategy.
But how we will know when its time to start buying back in?
Good question. Let’s take a look at the last two times the market had all of the confirming “sell signals” in place and what it looked like when it was time to “get back in.”
First, let me show you the entire picture for perspective.
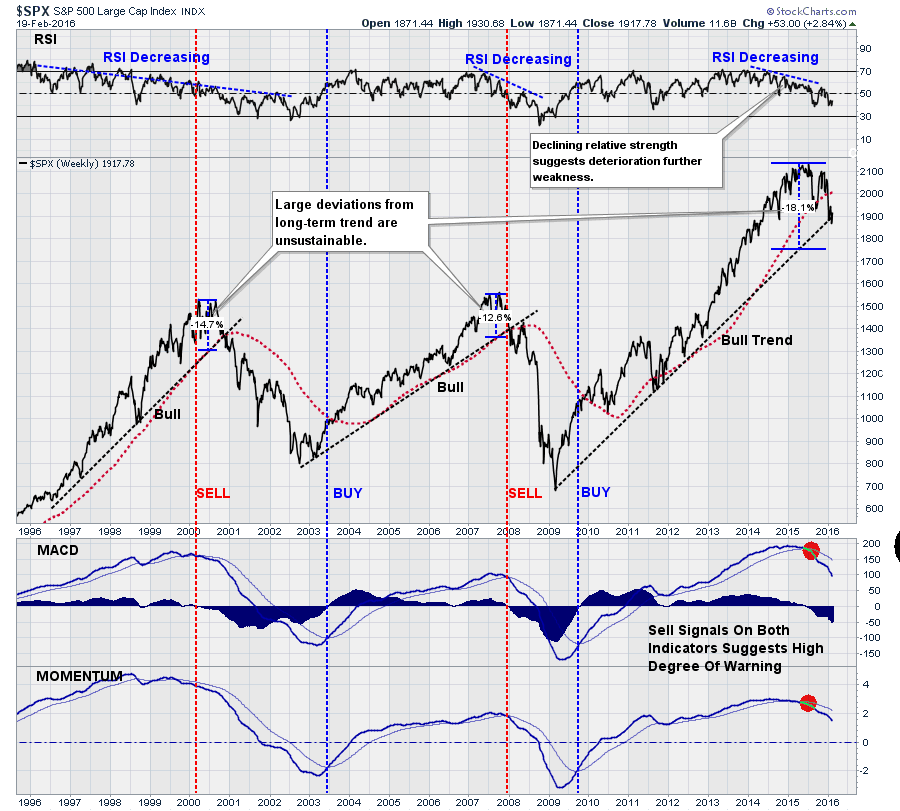
As shown, markets can only remain extremely deviated from their long-term trends for so long. Like stretching a rubber band to the extreme in one direction, the band must revert an equal distance in the opposite direction before it can be stretched again. It’s physics in action.
The red-dashed line is the 104-week moving average (2-years). As you will notice, the length of the moving average has corresponded with the primary bullish trend lines of the past three cyclical bull markets. The only violation of that moving average, outside of the onset of a bear market, was briefly in 2011 which was offset by the implementation of “Operation Twist” by then Fed Chairman Ben Bernanke.
So, with this perspective, we can look more closely at the signals we will need to see to provide the confidence necessary that the current “bear market” dynamics have ended.
Ending The 2000-Bear Market
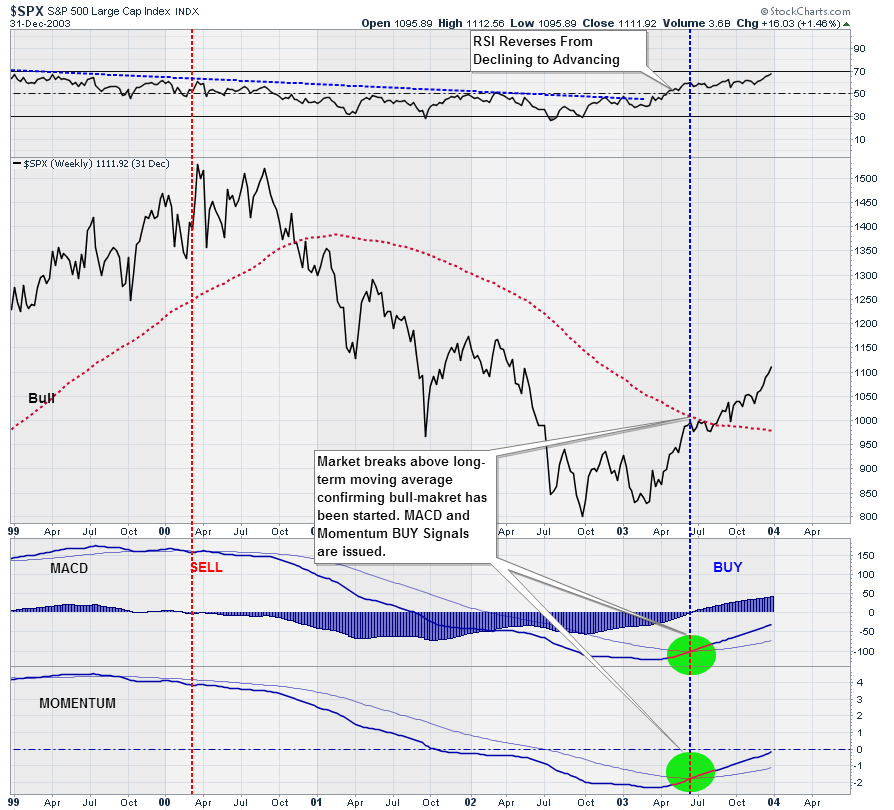
The confirmation that the “bear market” in 2001-2002 had ended was when relative strength stopped declining and turned back to positive. Furthermore, while “buying the exact bottom” was missed, when the longer-term confirming“buy signals” were issued, confirming a break above the long-term moving average, it was still VERY early in the bullish advance that would follow over the next several years.
Ending The 2008-Financial Crisis
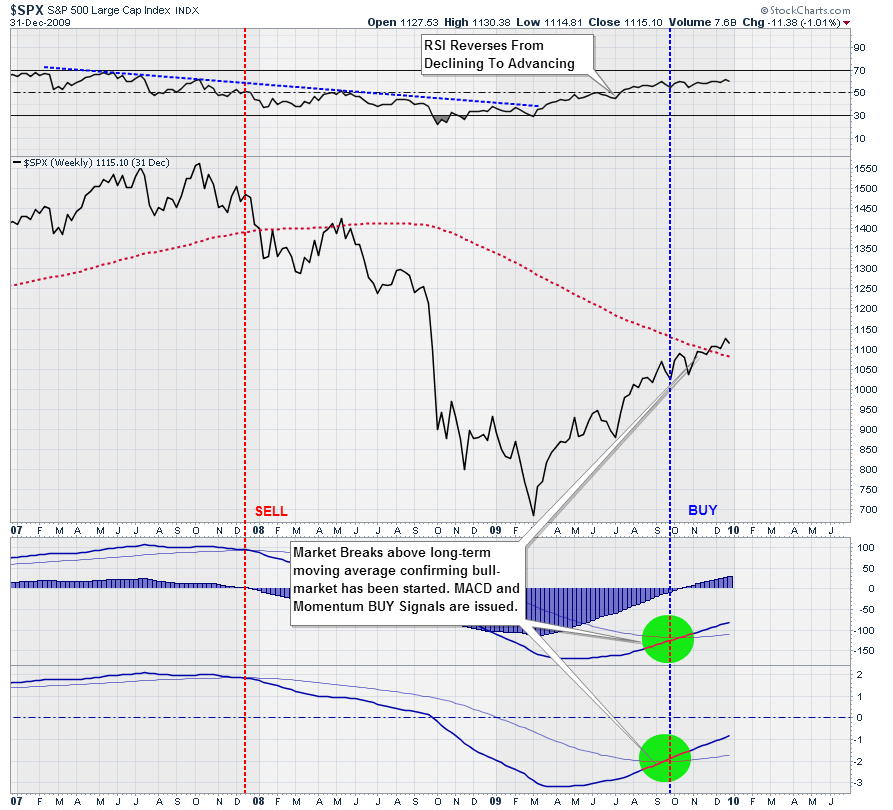
Again, notice the same exact bottoming behavior and confirmation of the start of a new bull-market cycle.
Currently, as shown below, all “sell signals” are currently in place with RSI still on the decline, momentum measures broadly negative and the market trading BELOW its long-term moving average. Does this even look remotely like a market ready to turn around and push higher?
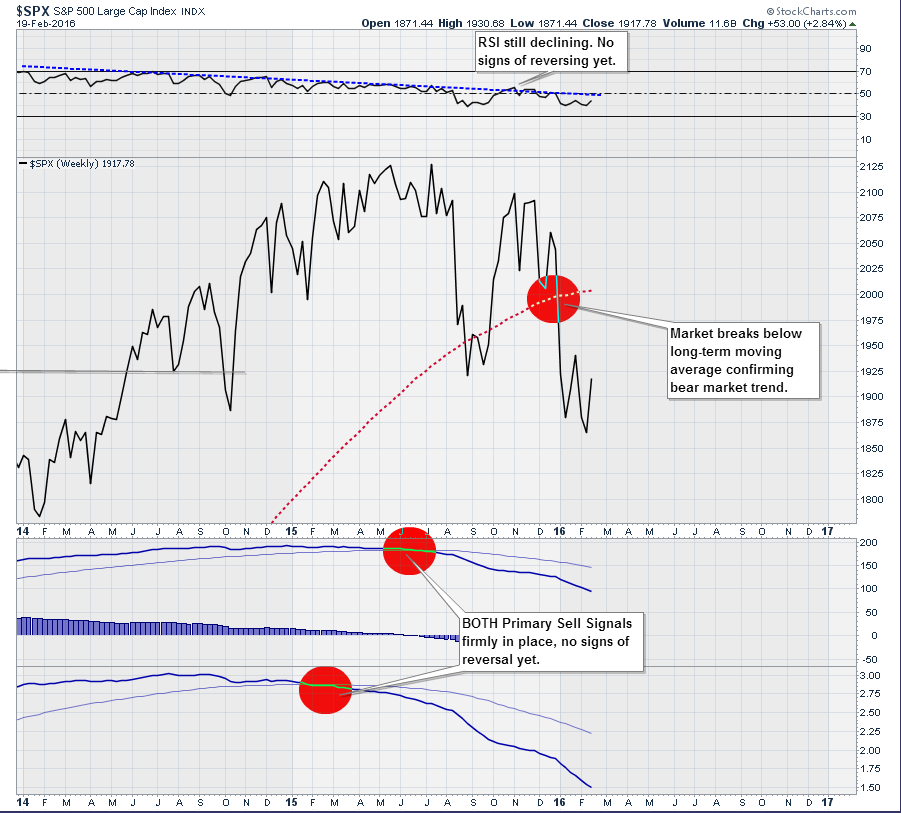
For now, we wait. When these indicators improve and turn back into the positive, which could be next week, month, or year, then it will be time to aggressively begin to increase exposure to equity risk as the bullish trend is re-established.
As investors, we should not be basing our investment decisions on “hope,” but rather an analysis of the evidence that would put the highest probability of “winning” in our favor. While you can certainly continue betting on “weak hands,” any good poker player will tell you that is a sure way to eventually go broke.
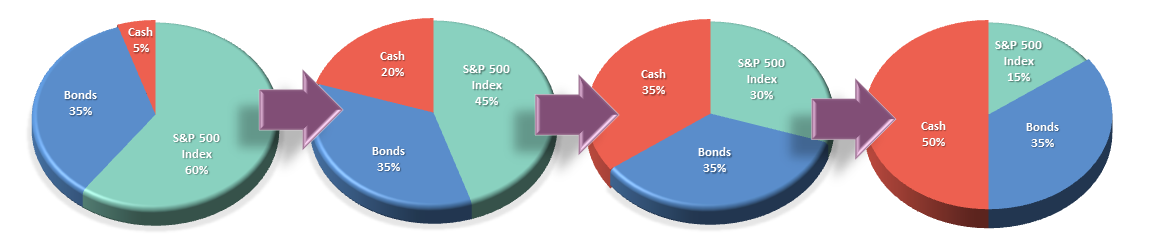
S.A.R.M. Model Allocation
If you are new reader to this missive, click here and review previous explanations of the S.A.R.M. Model.
I have adjusted the model allocation to account for the rebalancing of bonds, REITS, and Utilities in portfolios.
This past week’s bounce in the market was used to adjust weightings as follows:
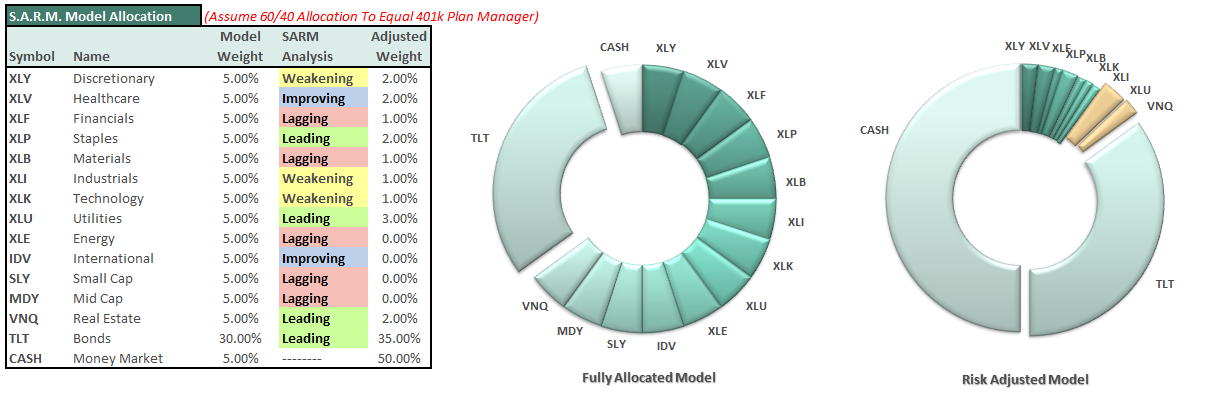
Last week’s rally increased CASH to 50% of the portfolio from 45%, with 35% in bonds, and 15% in equities.
It is completely OKAY if your current allocation to cash is different based on your personal risk tolerance. This is just a guide.
As you can see, there are not DRASTIC movements being made. Just incremental changes to reducing overall portfolio volatility risks. However, if the expected bounce fails at resistance, then further reductions will be required in accordance with the risk reduction modeling.
Remember, as investors, our job is not to try and capture every single relative point gain of the market as it rises. While we certainly want to participate in the rise, our JOB is to protect our capital against substantial losses in the future. A methodology that regularly harvests gains, reduces risk and keeps the portfolio focused on longer-term goals will lead to a more successful outcome.
THE REAL 401k PLAN MANAGER
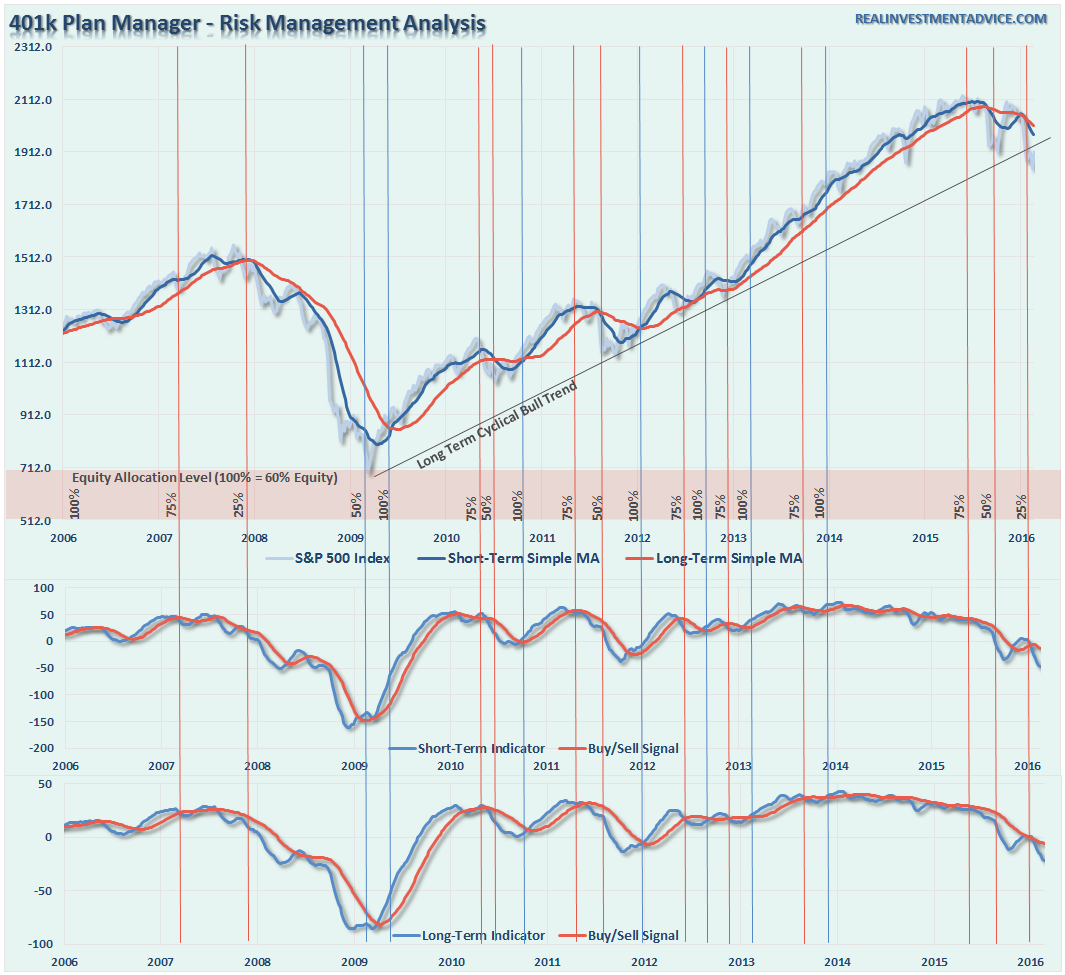
As you will notice, I never advocate being 100% out of the market. However, I will recommend a market neutral strategy once a confirmed bear market trend is established. As I have discussed many times in the past, it is far too difficult to reverse course when the market changes from a negative back to a positive trend. Emotions keep us from taking the correct action. There are 4-steps to allocation changes based on 25% reduction increments. As noted in the chart above a 100% allocation level is equal to 60% stocks.
SITTING AT TARGET FOR NOW
As I have repeatedly discussed over the last couple of weeks, the market has NOW BROKEN the long-term trend. Such a change in TREND is critical and suggests that the bull market advance that began in 2009 is over. As discussed throughout the entirety of this week’s missive, the technical damage to the market is significant.
Last week’s rally was enough to warrant reducing portfolio allocations to TARGET levels. As discussed in detail above, we are now in a position to just WAIT and allow the market to TELL us what it wants to do next.
While many will speculate on a resumption of a “bull market” in the short-term, the RISK of being WRONG far outweighs the possibility that such prognostications are correct. However, in the event the market does reverse course, and re-establish a bull trend, we will simply increase equity allocations back up accordingly.
Yes, it really is just that simple. As I wrote last week:
“Remember, it is far easier to add capital back into the markets as opportunities become more visible, rather than trying to figure out how to make up previous losses. “
Current 401-k Allocation Model
The 401k plan allocation plan below follows the K.I.S.S. principal. By keeping the allocation extremely simplified it allows for better control of the allocation and a closer tracking to the benchmark objective over time. (If you want to make it more complicated you can, however, statistics show that simply adding more funds does not increase performance to any great degree.)
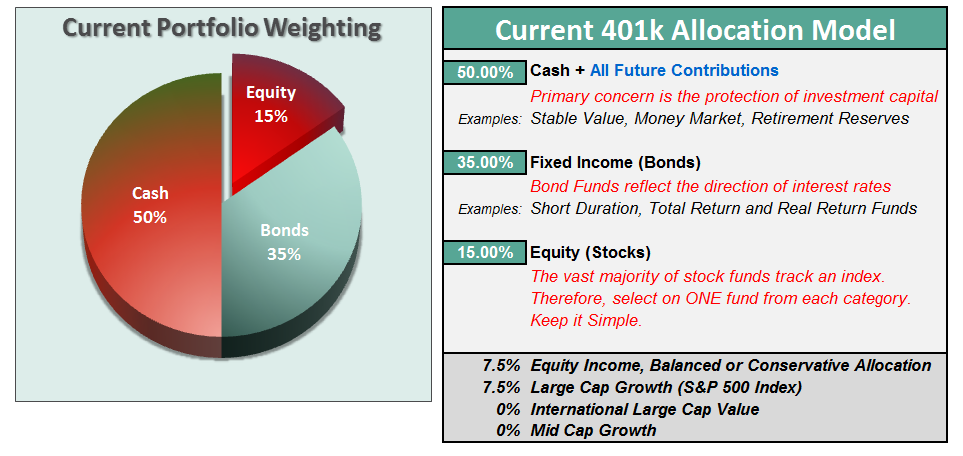
401k Choice Matching List
The list below shows sample 401k plan funds for each major category. In reality, the majority of funds all track their indices fairly closely. Therefore, if you don’t see your exact fund listed, look for a fund that is similar in nature.


Comments
Log in or sign up to join the conversation.